Introduction
Environmental surveillance is a big thing. Important for our health, but also resource consuming when it comes to designing a system that works. I started with the first unit to monitor background radiation back in 2012, pushed that to global scale with the uRADMonitor project for most of 2014, then approached the air pollution problem with the uRADMonitor-D for half of 2015. And this is just the beginning. To optimise the air quality assertion, we need better resolution (more units deployed) and better sensors. Both are progressing and the BME680 is an excellent example to that. To help resolution, sensors will have to conquer more in the space of wearables. This article will document an experimental setup to track pollution in my city, Timisoara, simply because we could all use better air here.
The hardware
The plan is to use a VOC air sensor and an optical dust sensor in a mobile unit, connected to the outside of a car, to build a heat map and see how the values fluctuate over time and location. Since some redundancy is usually a good thing, there are two sensors to measure air temperature, pressure and humidity, one for VOC and 5 large and sensitive SBM19 Geiger tubes to track beta and gamma radiation. Rechargeable battery and a bluetooth module to sync readings with an Internet connected smartphone are among the features. I designed a custom board to handle all these:


However, due to increased complexity, the toner transfer method failed to deliver a decent prototype:

So to save time, I simply went ahead using one of the uRADMonitor-D boards. The D model already uses all the sensors I needed for this project, it is portable thanks to the rechargeable battery so with just a few modifications I was able to adapt one board for the new functionality. There is also a custom firmware running, and all communication and control is done over the Bluetooth link.
The radiation detection part is interesting, as there are 5 large SBM-19 tubes connected in parallel for a very sensitive radiation detector.
To enclosure is made of plexiglass, with the top part covered with copper except for the area facing the bluetooth module. A micro USB connector for charging, the soft power button and an ISP 6 pin programmer are exposed one one side. As this is designed to be mounted on the outside of a car, there is a vent tube holding the sensors. Moving air will enter the tube and the sensors will read the parameters and send all data over the bluetooth link to a smartphone. A program running on the smartphone will then sync all data with the server.
If used stationary, a fan can be added in front of one of the air tube’s ends.
The software
There are three software components. One is the firmware running on the device, then a mobile application running on the smartphone (most likely an Android app) and finally the server side software that receives the data via HTTP Post, stores it in a mysql database and draws a heatmap for the frontend. The firmware is mostly focused on the sensors drivers and reading the data, the mobile app works as a relay getting the data over bluetooth and sending it to the server (the phone is a good solution for Internet connectivity) and the server component shows the results in a visual form.
Here are a few pictures showing the mobile app, that works as a Bluetooth relay, taking the data from the sensor unit and sending it only to the server:

I designed it for Android OS, also because of the available Bluetooth API, unlike on iOS where MFI is needed (the Bluetooth module I used, was NOT a LE one). The app has a nice Bluetooth discovery option, a connect button, and lots of text boxes for showing sensors output. There are even 3 buttons to control the unit, the shutdown, and two for audio effects since the sensor board, based on uRADMonitor-D, also has a speaker. On the invisible side, the app takes all data it receives over Bluetooth, and sends it via a 3G/4G connection to the server.
Results
To collect enough data I drove for a few kilometres across the city of Timisoara. Thanks to my beautiful assistant I got to have a demo video of the entire procedure:
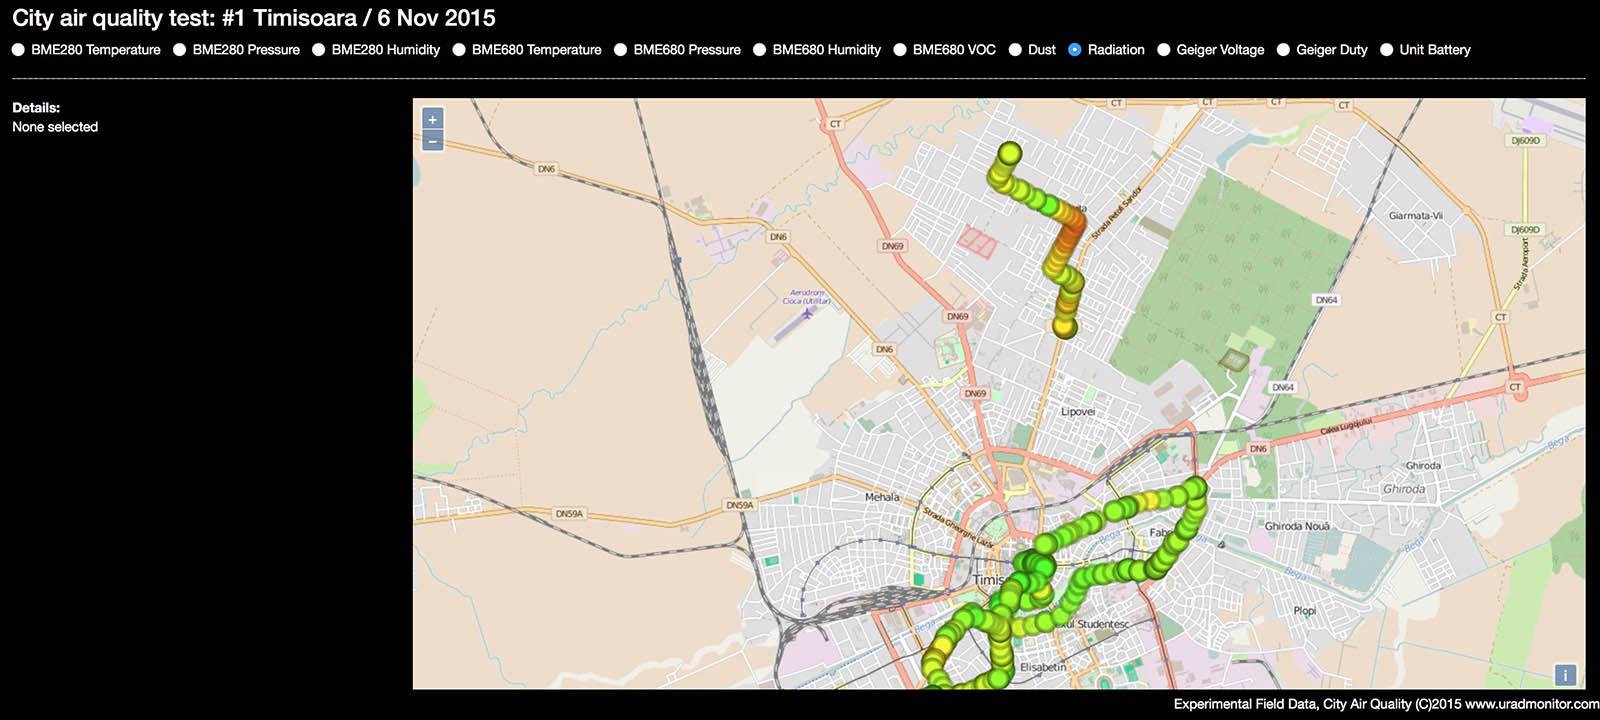
To better analyse the results of this first test, I had to built a web interface that plots all data across an OpenLayers map of Timisoara. While the sensor unit only features 5xSBM19 for sensitive radiation detection, a BME280 sensor mounted inside the unit’s case (for temperature, barometric pressure, humidity), a BME680 sensor (temperature, barometric pressure, humidity, VOC) mounted inside the air tube, a Sharp GP2Y1010 dust sensor, the smartphone also adds GPS details including latitude, longitude, altitude and speed. All this together results in valuable information regarding the environmental quality, mapped geographically to exact location. The data can be accessed on the interactive map.
The Dust and VOC parameters need some additional work, so as said, this entire project so far is experimental, and has the purpose of identifying the starting point for providing this kind of environmental surveillance at a city level. A very interesting discovery is a raised radiation measurement, in the North side, where increasing readings are consistent to approaching to a radiation source, while departing the area shows the expected decrease, unlike an isolate spike in readings. See the second photo below for a closer look:
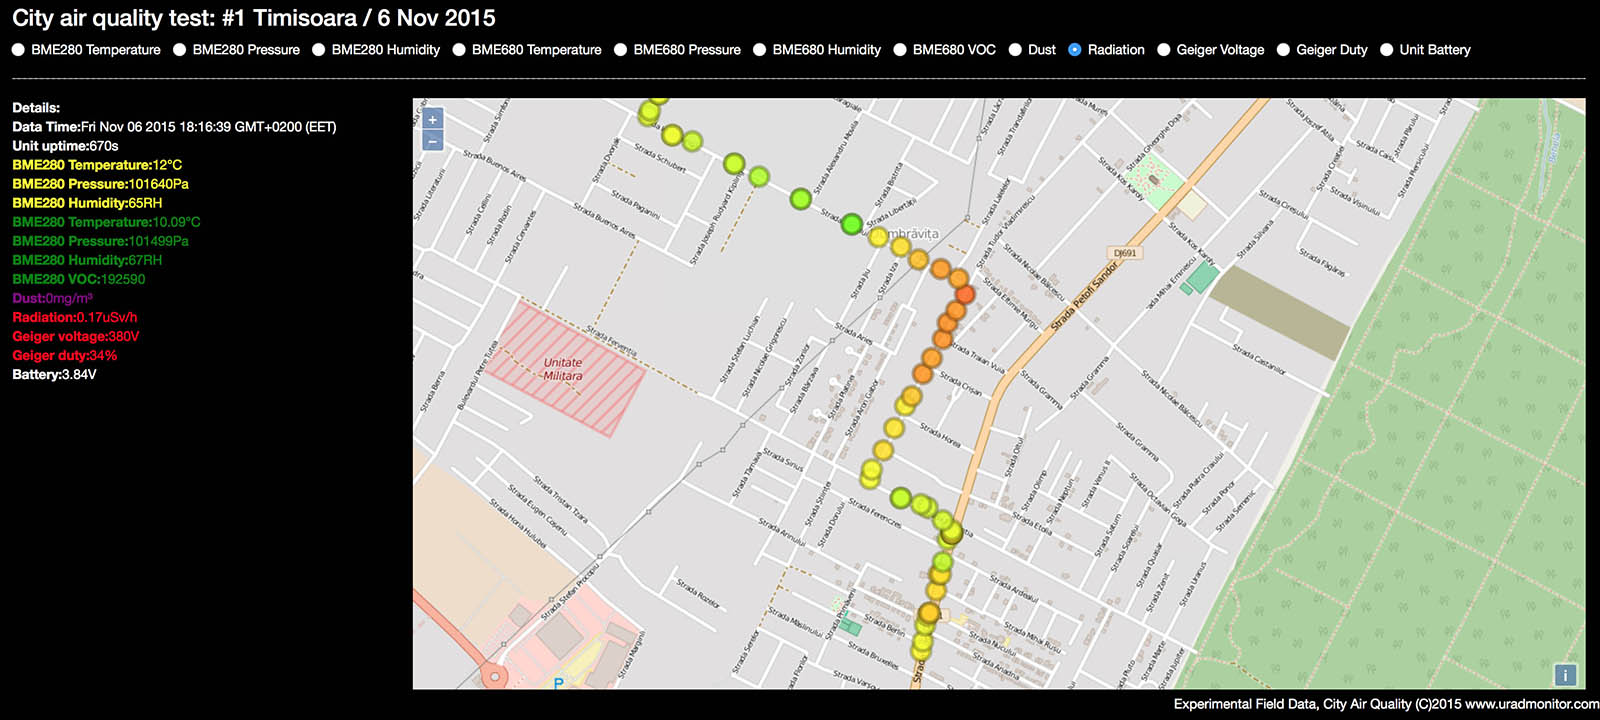
I’m definitely curious about the elevated radiation readings in that area, while the numbers are not big, there must be a cause, especially given the increased detection distance. Here the sensitive Geiger detector played its role. I will research the phenomenon further and report back with more details. Click here for the interactive map, to see the data yourself.
This article has 1 Comment