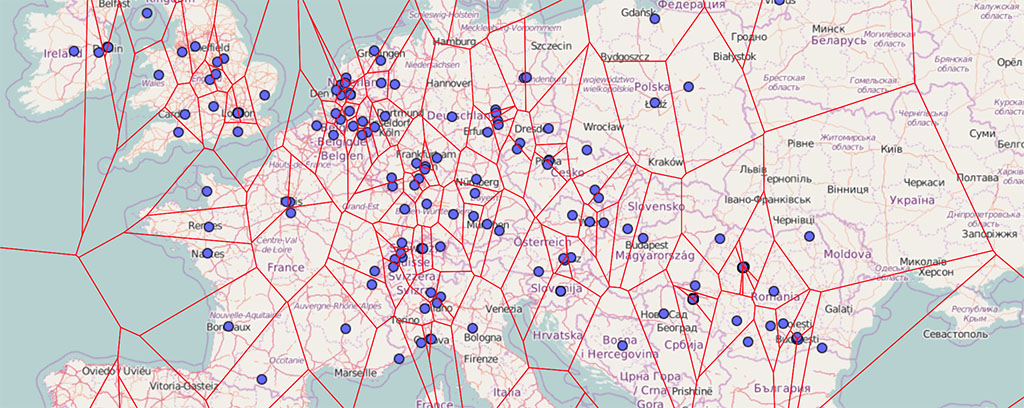
Voronoi diagrams and OpenLayers 3

July 24, 2016

OpenLayers is an opensource javascript library for rich web-based geographic applications. I recently had to represent temperature readings on a map. The first idea was to use heatmaps, due to their nice blur and colour gradient effects. There is native support for heatmaps in OpenLayers 3: Demo code on JSFiddle. function initHeatmap(src) { return vector = new ol.layer.Heatmap({ source: src, blur: 2, radius: 8, weight: function(srcObject) { return parseFloat(getDoseRate(srcObject.get(‘averagecpm’), srcObject.get(‘factor’)))…

Read More >>