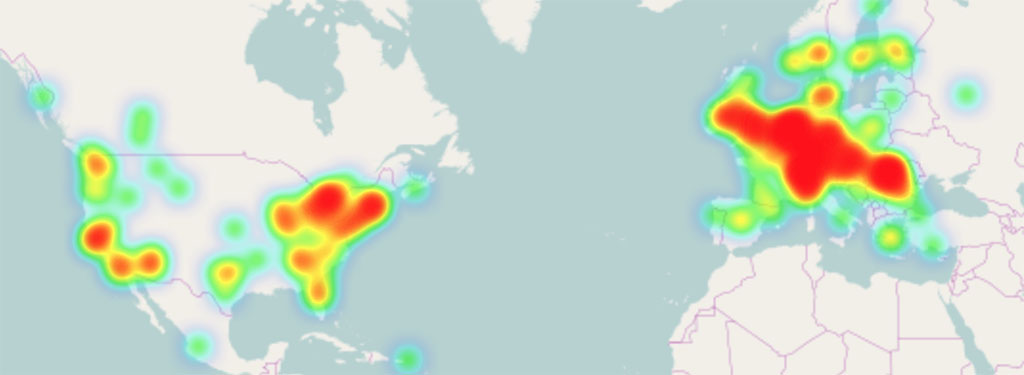
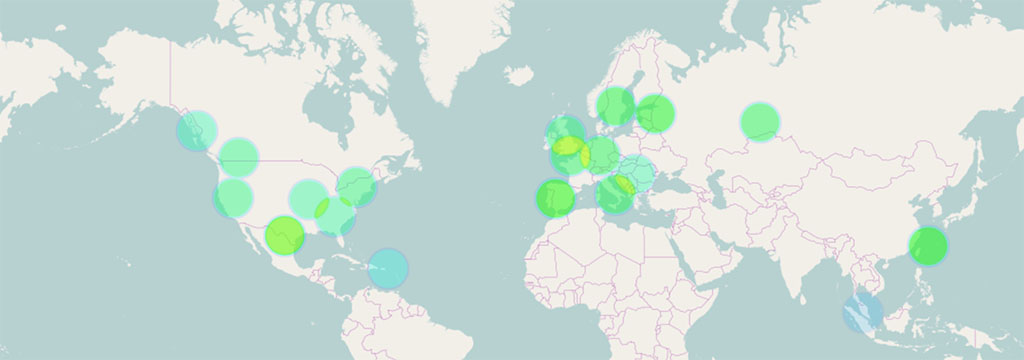
OpenLayers is an opensource javascript library for rich web-based geographic applications. I recently had to represent temperature readings on a map. The first idea was to use heatmaps, due to their nice blur and colour gradient effects. There is native support for heatmaps in OpenLayers 3:
Demo code on JSFiddle.
function initHeatmap(src) {
	return vector = new ol.layer.Heatmap({
        source: src,
        blur: 2,
        radius: 8,
        weight: function(srcObject) { return parseFloat(getDoseRate(srcObject.get('averagecpm'), srcObject.get('factor'))) / 0.30;  }
      });
}
It looked nice, but soon it became obvious that these heatmaps are not suitable for temperature (or other point based measurements) since they are a function of both point density and data weight, and we only want the latter. Overlapping points would simply intensify the colour gradient indicating higher readings, instead of an average. I went into the openLayers heatmap code, planning to modify this behaviour and make it fit my purposes, however the heatmap algorithm translates the weight into opacity and that simply gets summed up for overlapping points, so not much to change there.
Heatmap alternatives for the temperature map
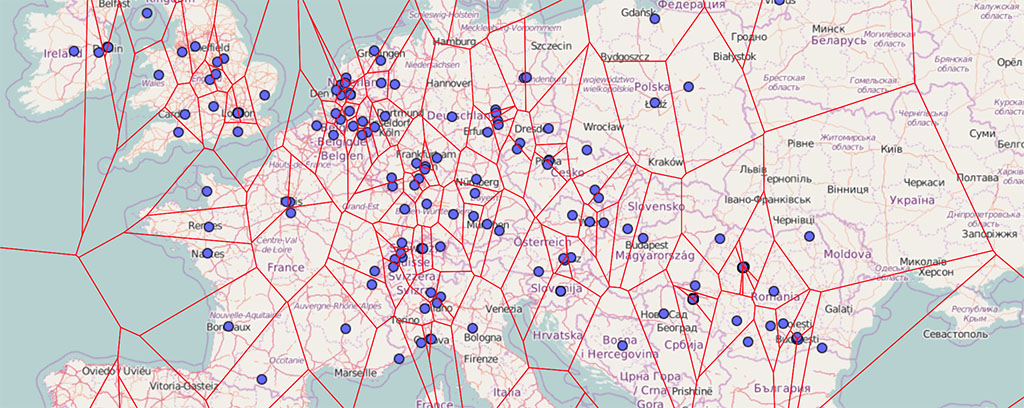
One idea was to group map points into clusters. OpenLayers offers clustering. With a custom color gradient function, I could simply compute the colour of each node based on its temperature equivalent. For clusters, the average of all contained nodes would be used instead. The strategy for vector feature clustering would be selected in such a way that we won’t have any overlapping points. And the clusters can be used directly for the heatmap layer. The result looked like this:
/* define the cluster strategy here */
var clusterSource = new ol.source.Cluster({
	distance: 40,
	source: vectorSource
});
return clusterSource;
Clusters demo and code on JSFiddle.
You can see in the picture that the clusters are still overlapping, that is a minor issue as you can adjust the “distance” parameter to avoid overlapping. However with clusters you’re getting a single colour and so a single indication for a very large surface. Sure, you can zoom in, and smaller clusters and details will become visible but the problem is the same: with clusters we’re loosing resolution, so instead of seeing temperature variation from one location to another, we’re seeing very large surfaces being averaged. Not exactly a good solution for representing variation correlated to geographic location. Others tried this direction as well, see this example.
Some alternatives:
D3.js library used to create hexagonal heatmaps:
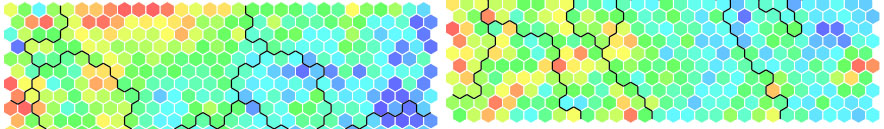
Similar techniques here, here or here.
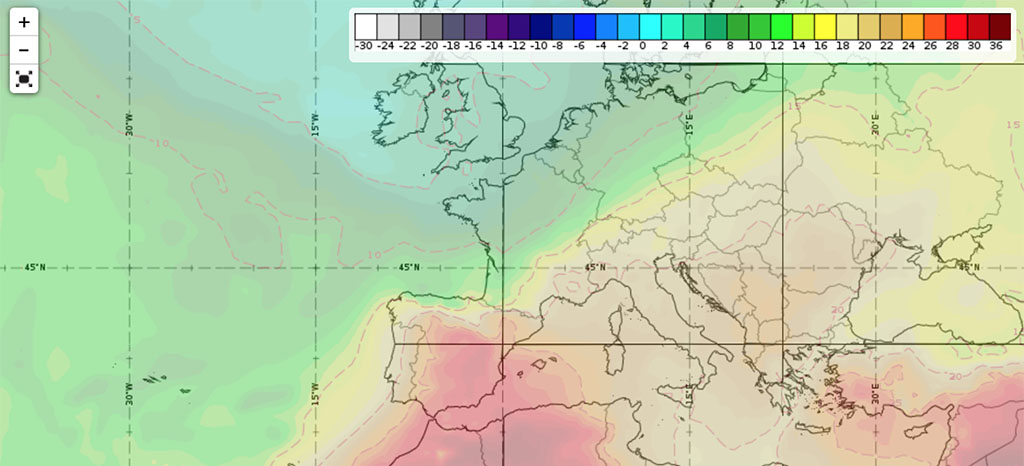
OpenWeatherMaps temperature redering, using server side generated tiles, displayed with Leaflets library:

A very time Time Dimension Example, but for Leaflet:
Geoserver implementation for OpenLayers
Using Voronoi diagrams and OpenLayers 3
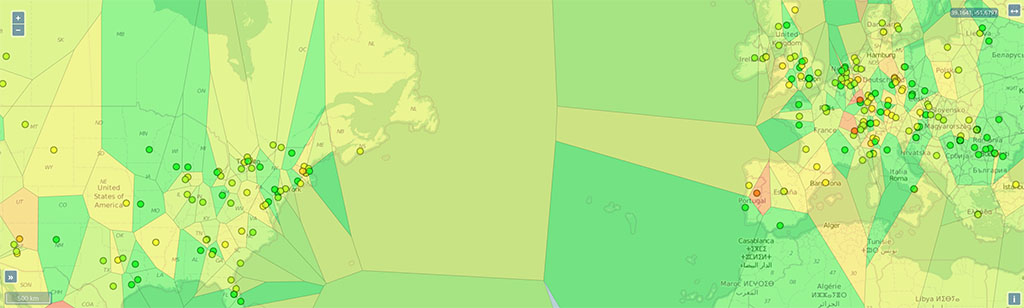
A Voronoi diagram is a partitioning of a plane into regions based on distance to points in a specific subset of the plane. The initial set of points is the data we start with, and for each there is a corresponding region consisting of all points closer to that one than to any other. These regions are called Voronoi cells. Colours can be used to make representation more suggestive. Since we have a set of points to begin with, splitting the map into temperature zones using the Voronoi diagrams seems like a good approach.
OpenLayers 3 can work with D3.js and have the drawings layers as a SVG in an Image layer. For this example I used the D3.js to compute the Voronoi polygons for a set of points, but the polygons were rendered using OpenLayers directly.

Implementation details
We have a dataset, resulting from a restful API. It contains coordinates (latitude , longitude) and various measurements. These are fed to an array before calling the voronoi function:
positions.push({
	coords: [device.longitude, device.latitude],
	value: getDoseRate(device.averagecpm, device.factor) * 100 / 0.30
});

var voronoi = d3.geom.voronoi()
	.x(function(d) { return d.coords[0]; })
	.y(function(d) { return d.coords[1]; })
	.clipExtent([[-180, -85], [180, 85]]);

var polygons = voronoi(positions);
As you can see we apply the voronoi function to the list of coordinates directly, the function will take an array of point coordinates, and provide the output in the same coordinate reference (latitude, longitude), very convenient for displaying it with OpenLayers polygon functions.

The complete demo code is available on JSFiddle, here. This is more of a proof of concept, more work is required to call the voronoi function on the features array so we don’t use a separate array, finally to correct the fill colour for the polygons, to match the data we want to display. The points in this example are correctly coloured, but the background of the voronoi polygons is not. I leave that change to my readers.