
The portable environmental monitor addresses pollution, the kind that we are unable to see but directly affects our health and causes life threatening diseases. Airborne toxic chemicals, radioactive dust and radioactive radon are correlated with cases of pulmonary cancer.
Since our biological senses can do little to warn us of such possible dangers, the plan was to design the Portable environmental monitor as a first line detection and warning system.
This is not the regular detector: packed with powerful sensors capable of detecting both the chemical and the physical harmful factors, these devices are designed with Internet connectivity thanks to a 802.11B/G wifi module, and will share all readings to the Global uRADMonitor network.
With online data we can build graphs, stats and send automated notifications when certain thresholds are reached. The infrastructure has been developed for the uRADMonitor project, semifinalist of HaD 2014.
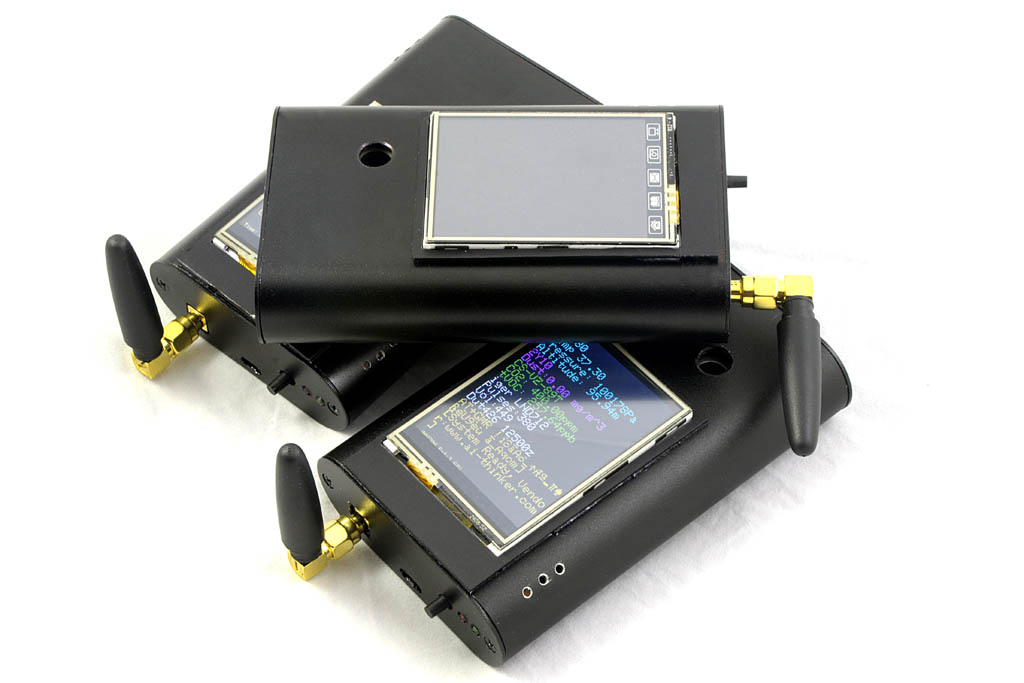
After a sinuous but exciting road, the Beta prototype came out nice, the entire device is amazingly small: I was able to design it to fit the 110x70mm aluminium enclosure I planned initially without renouncing to any of the sensors nor reducing the 1500mAh lithium battery. See it for yourself, here’s the video presentation for the #bestproduct hackaday prize competition:
Producing the Beta hardware
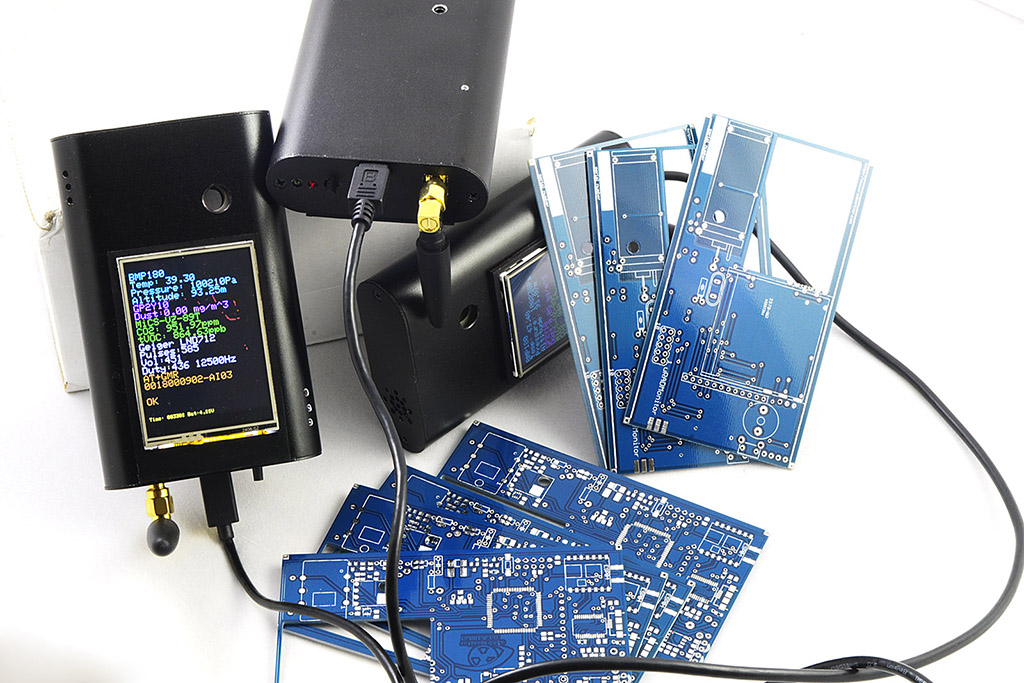
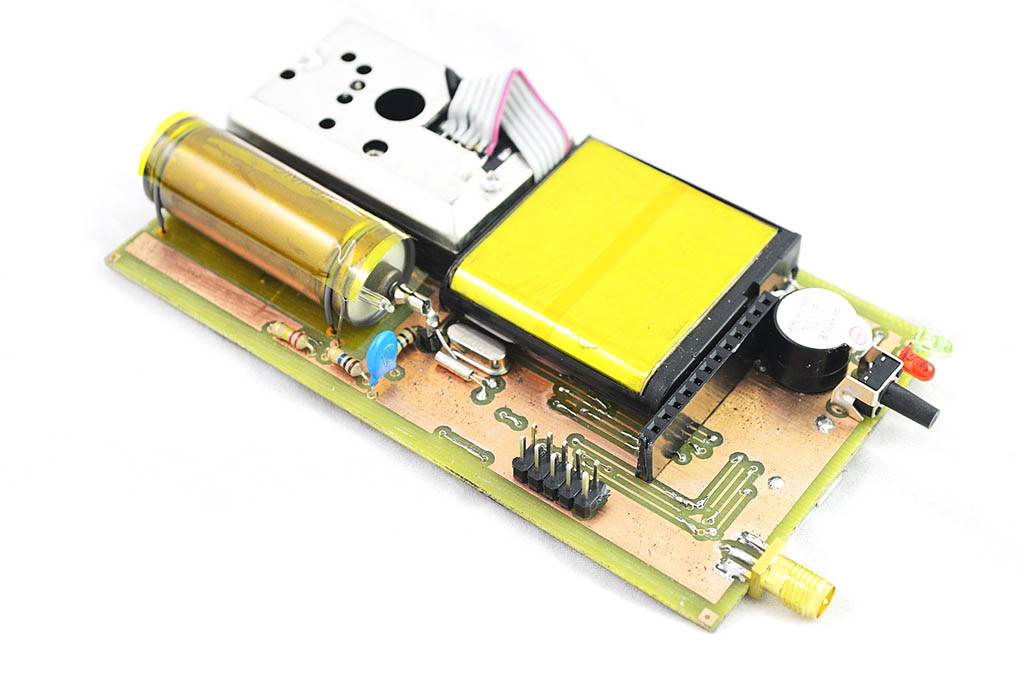
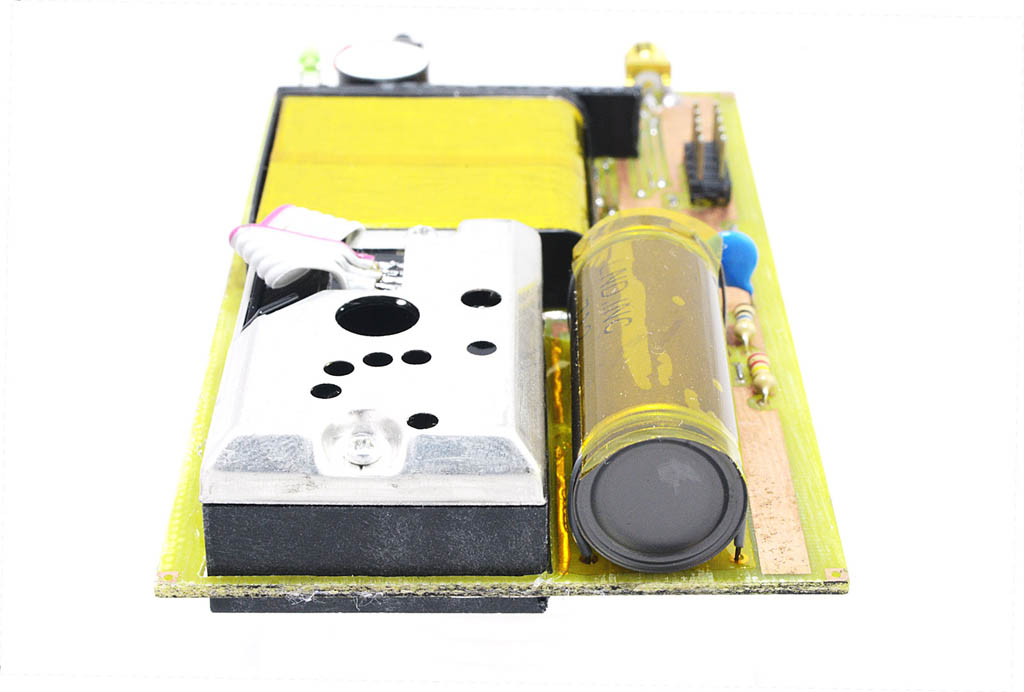
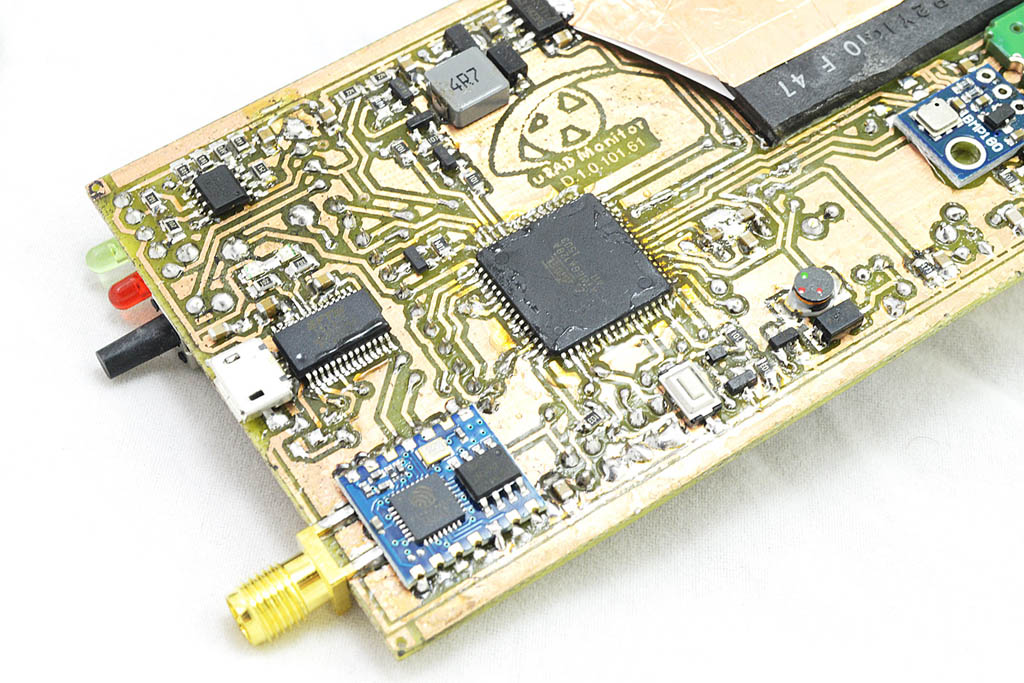
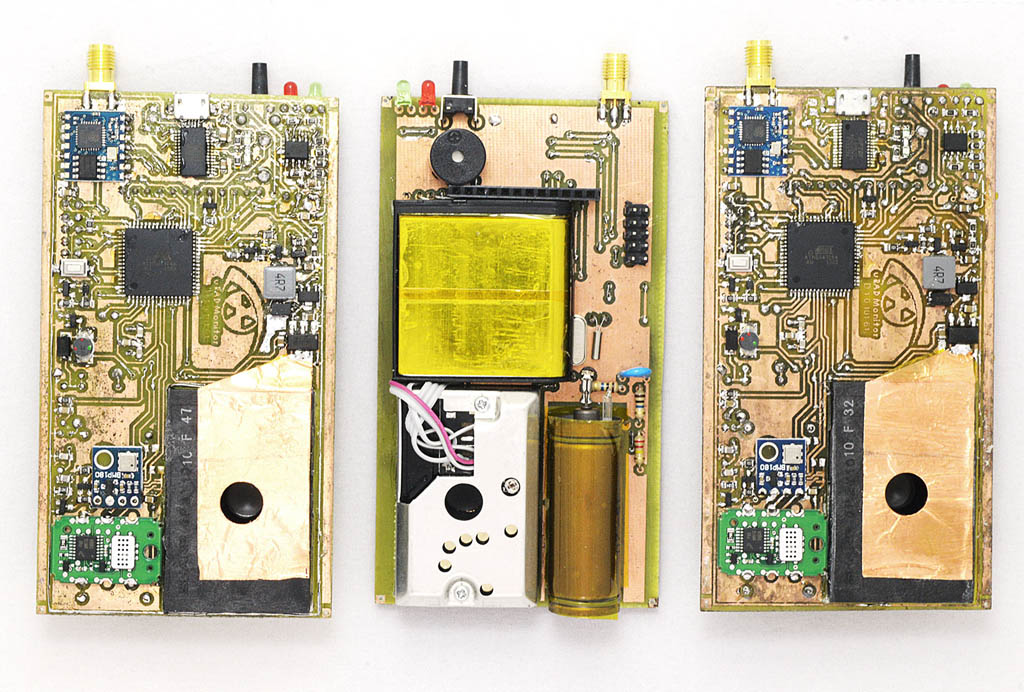
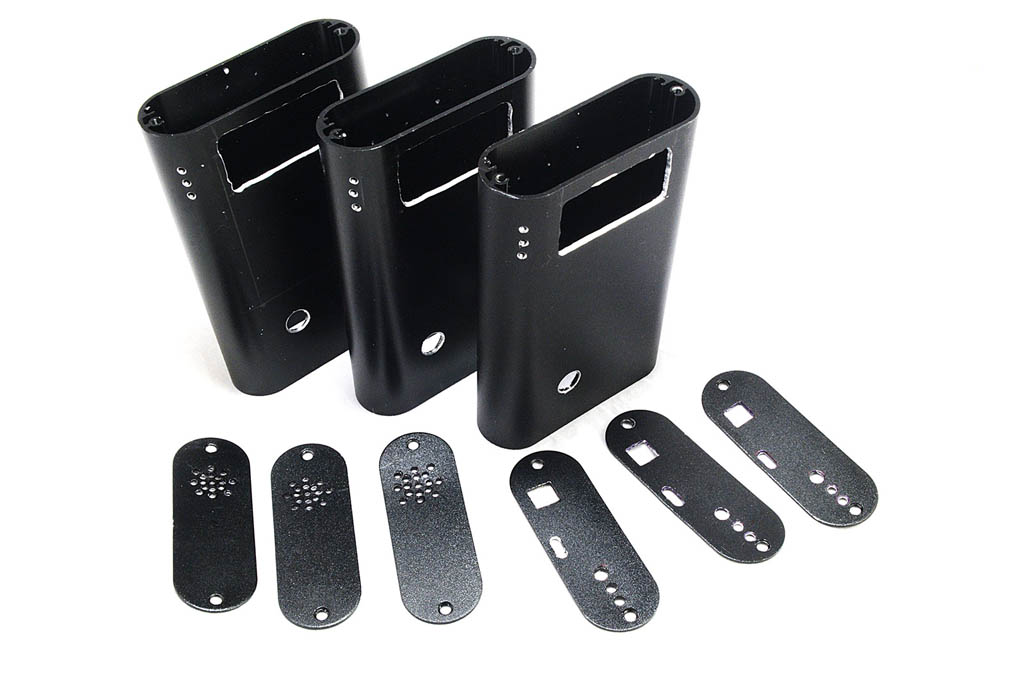
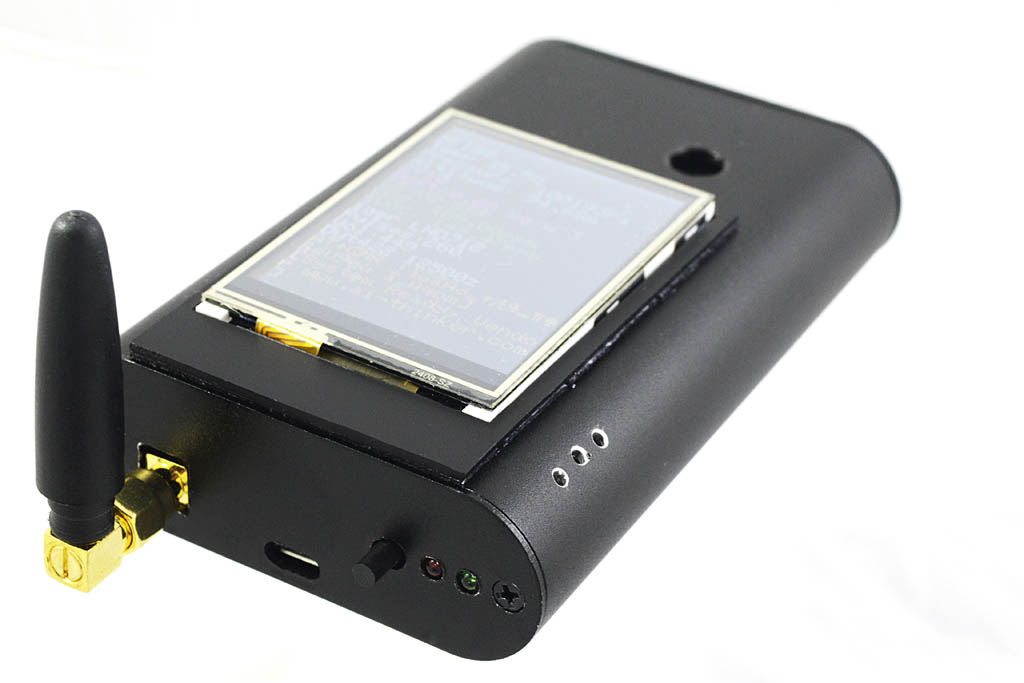
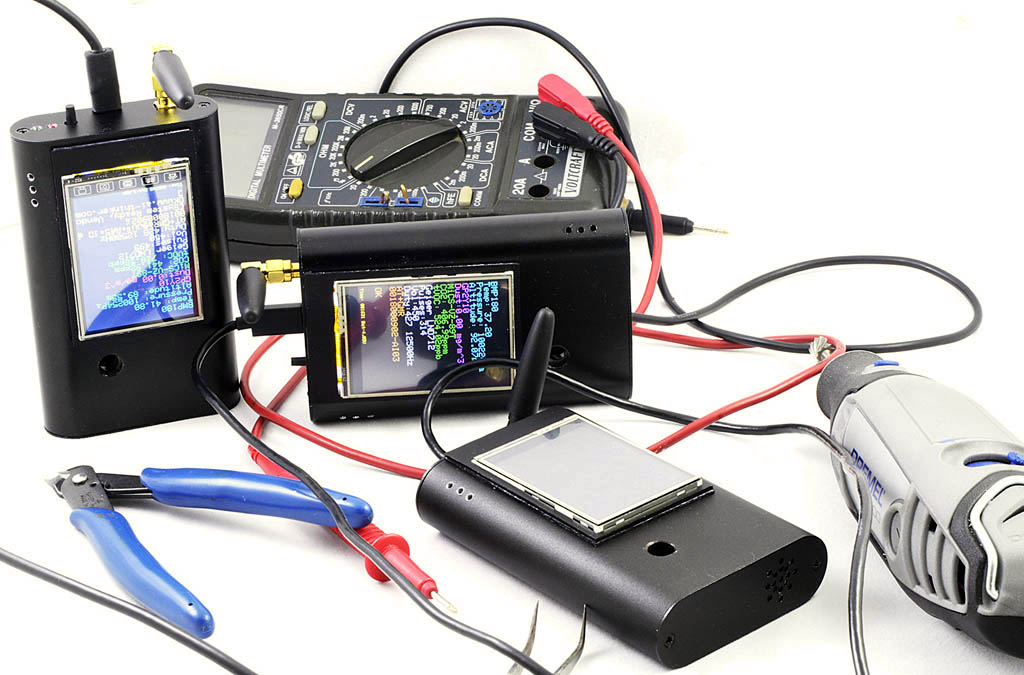
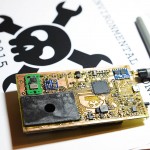
The day before I got an express package from China with the pro PCBs, but my 3 units were already fully assembled. Manually, that is etching the PCBs, drilling tens of holes, soldering tiny 0805 components with the soldering iron, using power tools to drill and mill the strong aluminium of the 3 enclosures. I had no time, nor additional MiCS-VZ-89 sensors for more units. But those PCBs look good:
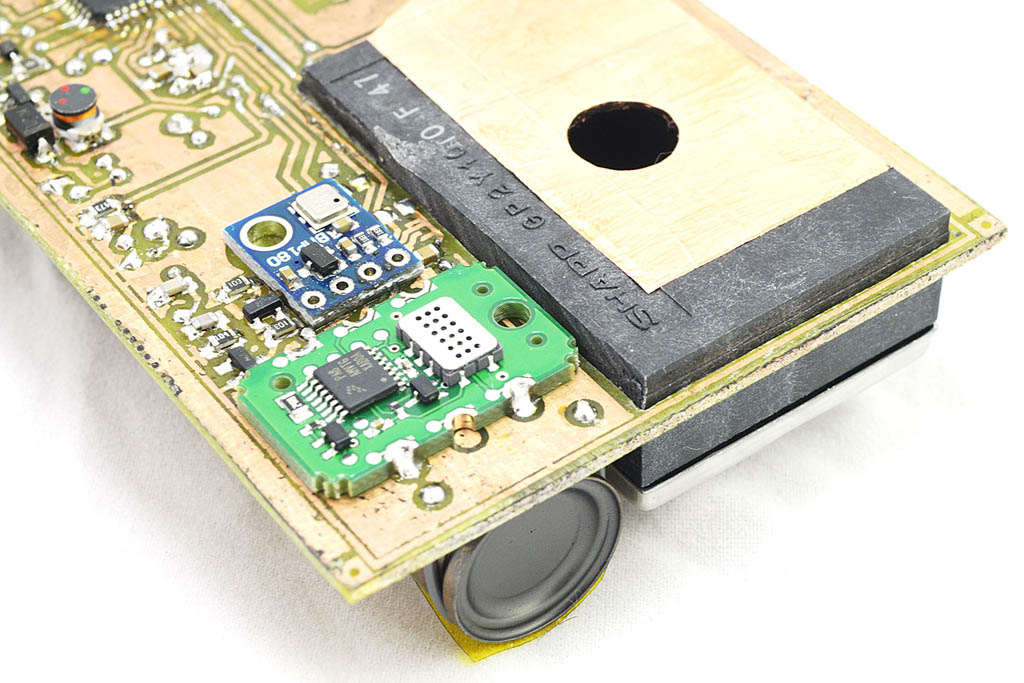
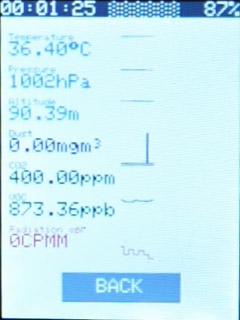
There’s the MiCZ-VZ-89 advanced air quality sensor measuring CO2 and VOCs in air, the neat LND712 Geiger tube for alpha, beta and gamma radiation including its high voltage regulated inverter, the GP2Y10 dust sensor and the BMP180 for temperature and pressure while the PCB allows soldering an additional BME280.
The Aluminium enclosures
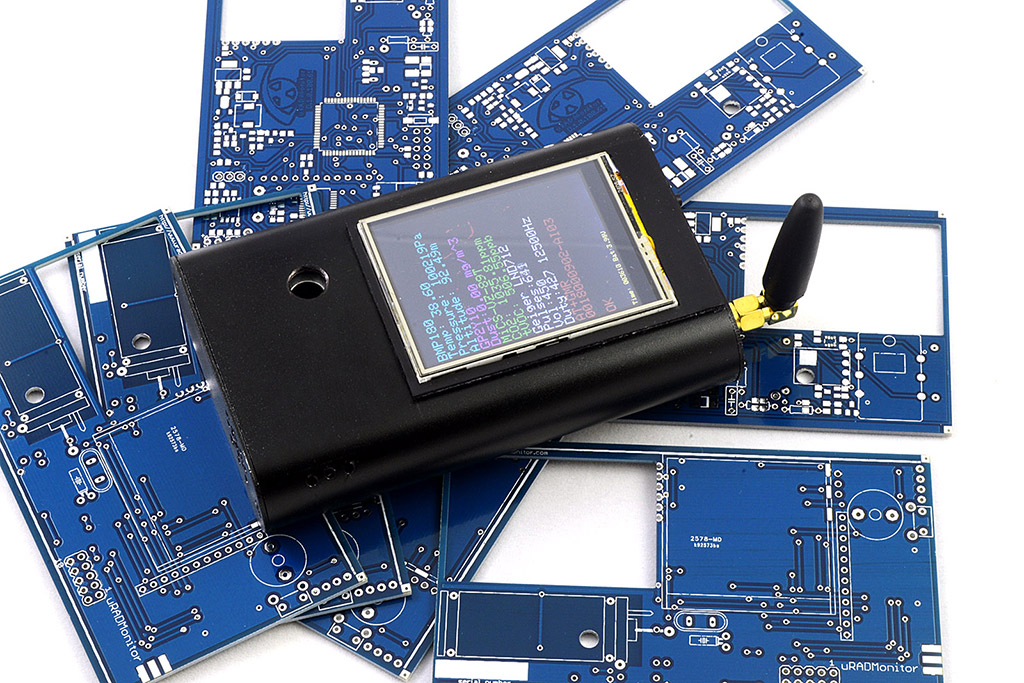
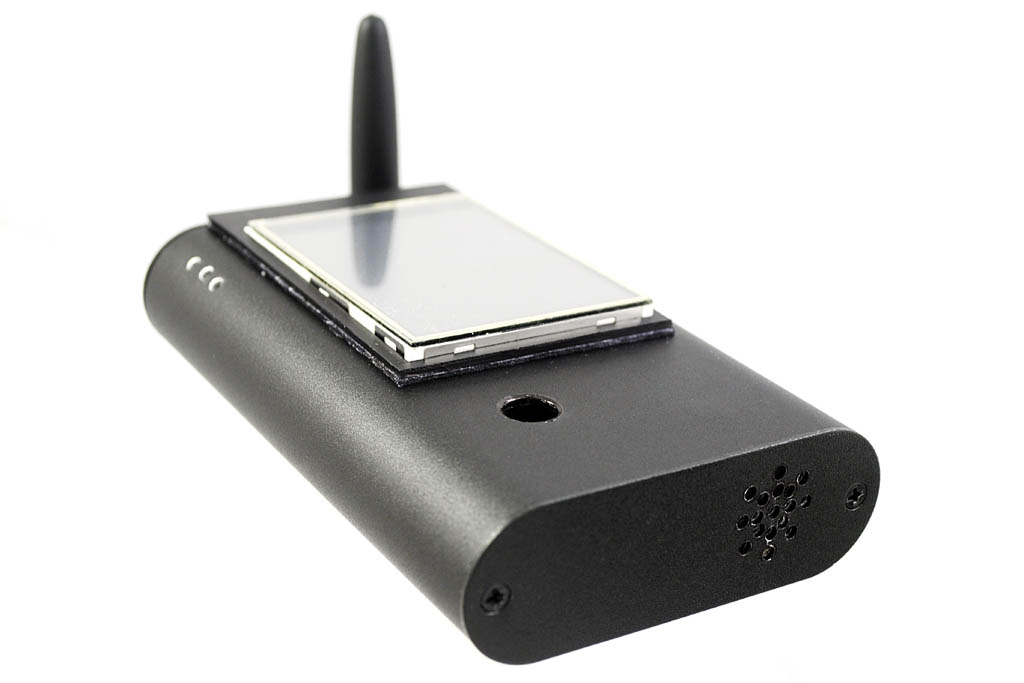
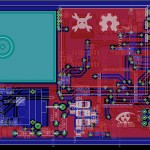
First thing to do was designing the final enclosure. The design files can already be used in a factory to produce machined enclosures, including nice silkprint to label the various connectors.
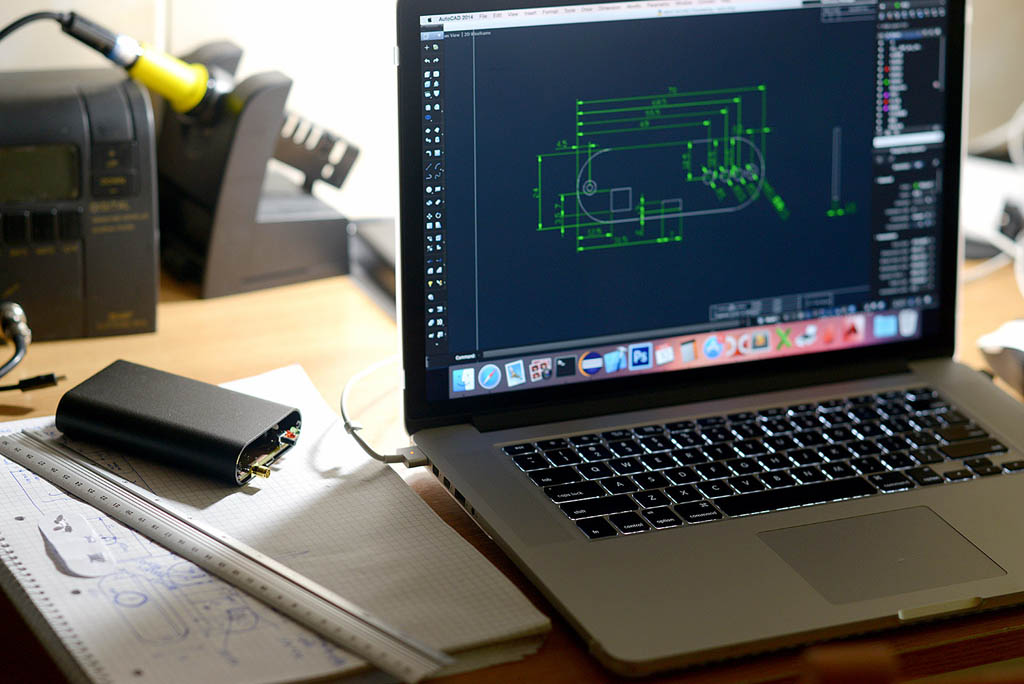
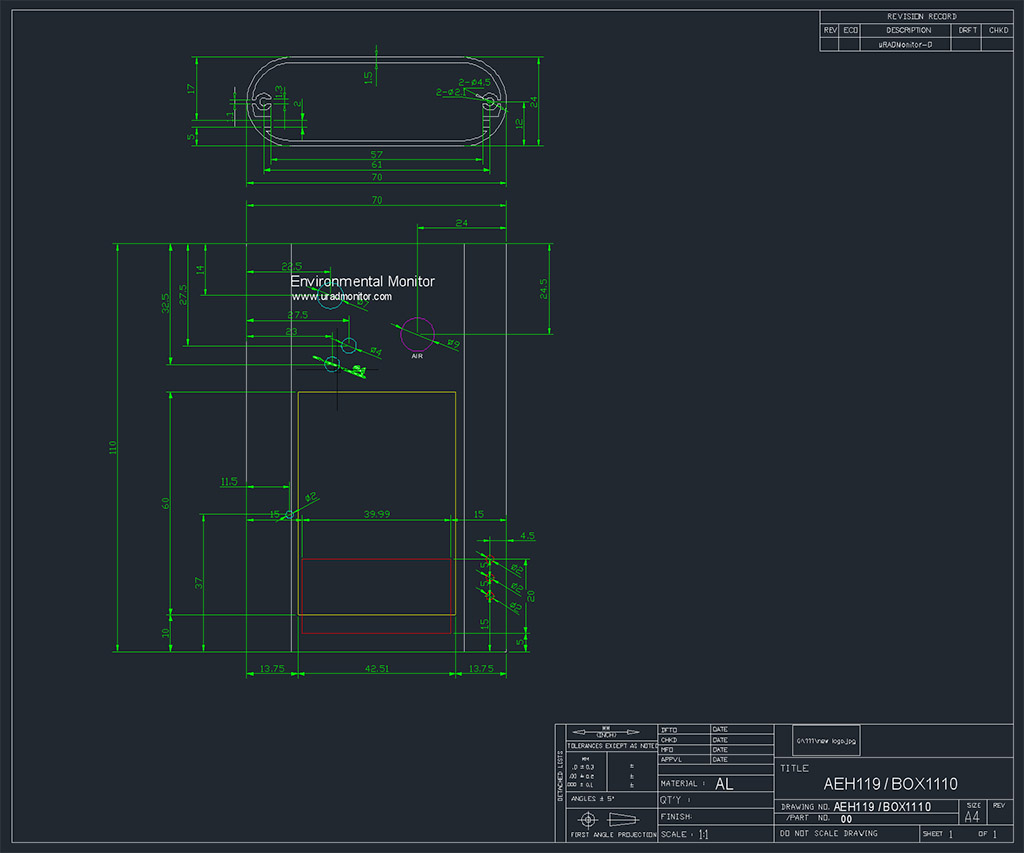
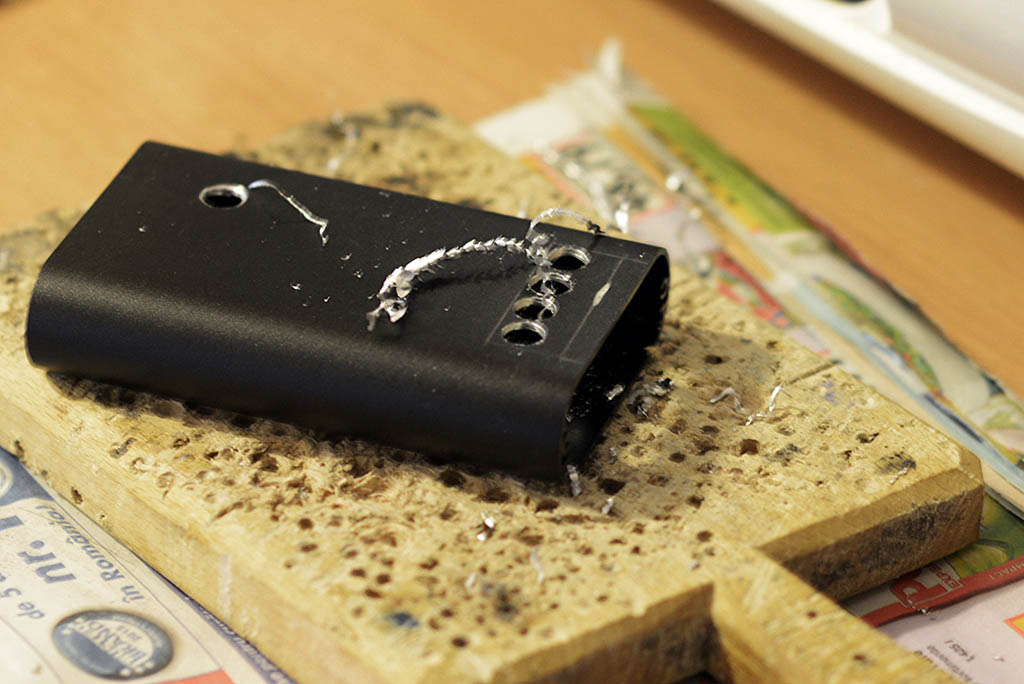
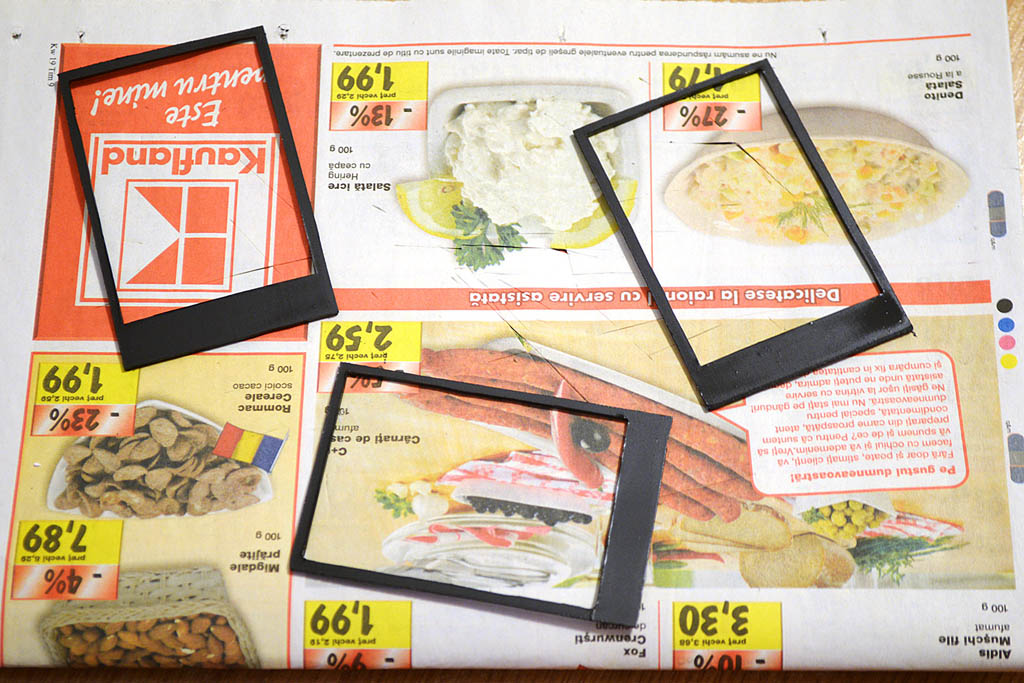
Cutting aluminium is easy if it’s thin. I found out my cases won’t take the fast spinning diamond disk, so my solution for milling was drilling as many holes as possible to remove the unneeded material, then use a Dremel with a nice milling head. A CNC router would have done wonders here, yet I was able to do it by hand just fine. For drilling holes, I saw that drills for wood give more precise results in aluminium due to their sharp tip better penetrating the material. For the LCD holders I initially wanted some 3D printed parts, but there was no time for that, so I opted for making them out of plastic sheets and painting them black afterwards.
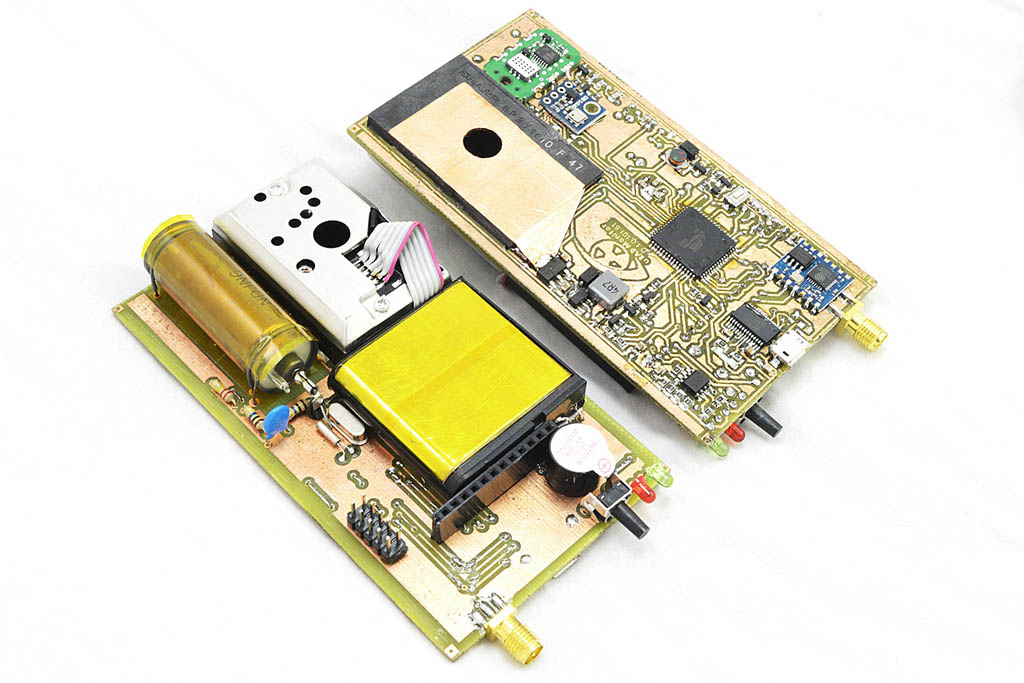
The hardware ready
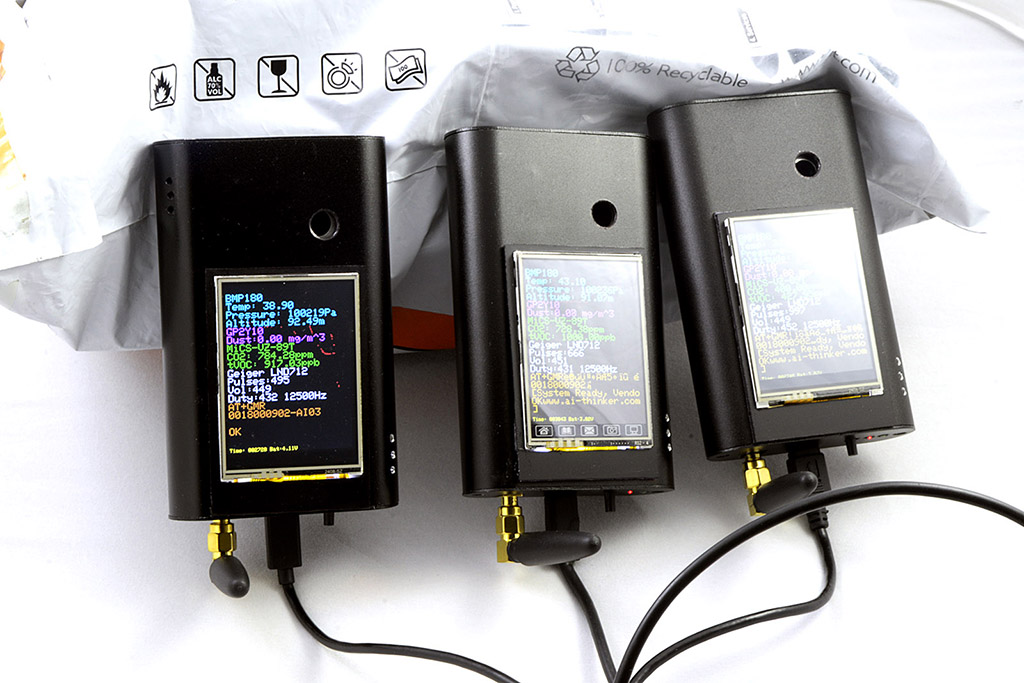
For a single man, this was an enormous effort, but after less then one month it gave an amazing product. Finally the hardware is ready in all its beauty:
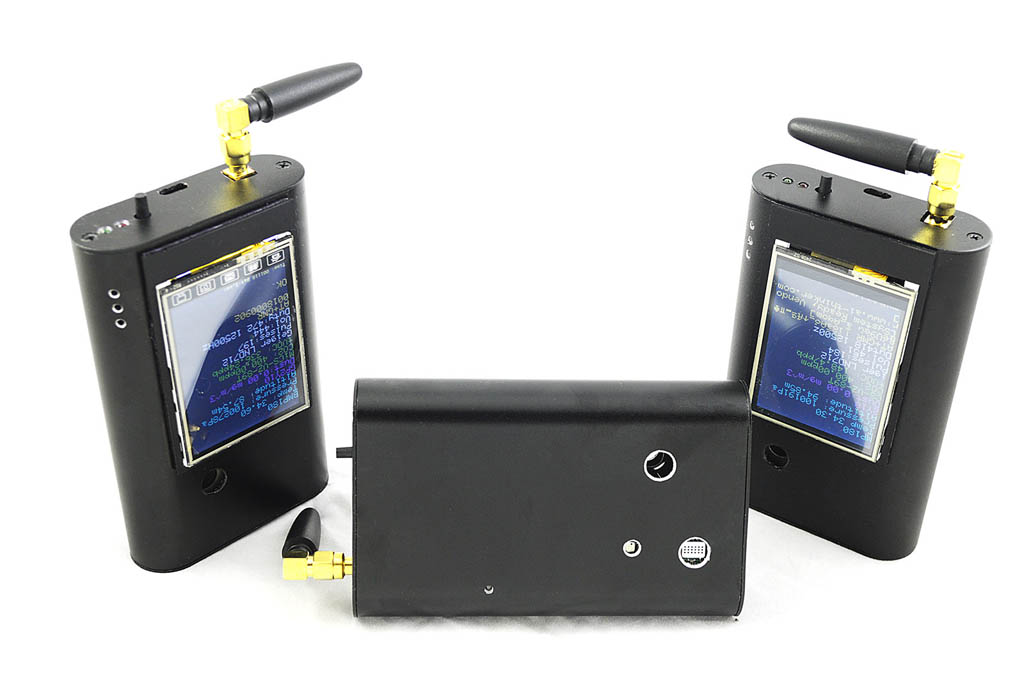

As we speak the three prototypes are on their wait to the Hackaday Headquarts to participate in the Hackaday Prize 2015 #Bestproduct competition.
Hardware vs software
It would be more appropriate to call the software Beta while the hardware is a little further developed. The beta hardware needs a few changes, like better energy management, renouncing to the 5V boost converter and changing the high voltage inverter to a multiplier topology so it can run from 3.3V, and changing the 3.3V LDO regulator to a more efficient energy management, most likely something based on a LTC IC (eg. LTC3440). Also the LCD connector needs to be standardised, as at this moment it is custom and a bit hard to assemble / disassemble (still looking for 0.8 pitch 18pin smd connectors). The ISP connector must be moved closer to front, and changed to a 6pin type, that’s enough for ISP programming. ESP8266 ESP04 changed to ESP08 for some extra RF interference protection. A micro-sd would be a nice add-on to collect data while offline. But these are all just optional improvements. With the hardware operational, and all mess cleaned up, it was time to sit comfortably at the desk and start coding the software. After all, that’s what I was trained to do:

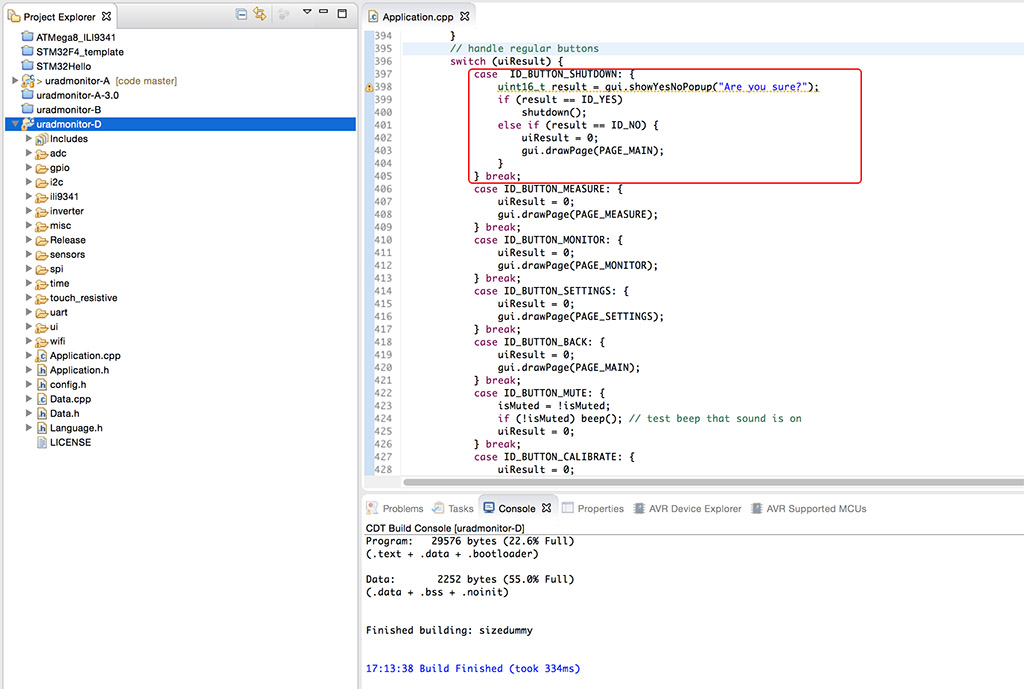
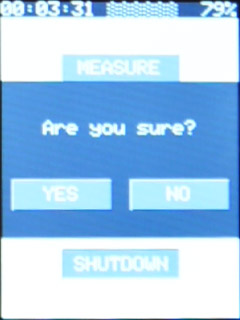
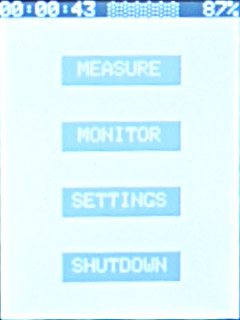
The plan was to have a single hardware button – the soft switch used to turn the device on, on the bottom near the usb connector, and use touchscreen interaction for everything else. It was obvious we needed buttons and various other UI controls readily available on any modern OS, but how to do everything on an AVR Atmega128? I had to start with the software architecture . While the hardware model traditionally allows a main loop and a few precious interrupts, I had to think of handling the UI while reading sensors at the same time. Popups used for confirmation (see the shutdown prompt in the video) raised additional problems, since modal dialogs might freeze the other components if not properly designed.
While time was short I tried to do it right, leaving just a few improvements for later. The functionality was split in dedicated classes, for instance we have a class to define buttons, responsible for those you see in the video:
#pragma once

#include
#include "../ili9341/ili9341.h"
#include "../touch_resistive/TouchScreen.h"

#define MAX_TEXT_LENGTH 20
class Button {
public:
    enum State {
    	BUTTON_DISABLED = -1,
    	BUTTON_UNPRESSED = 0,
    	BUTTON_PRESSED = 1
    };
private:
	ILI9341 *m_lcd;
	uint8_t m_size;
	uint16_t m_x, m_y, m_w, m_h;
	uint16_t m_id;
	State m_state;
	char m_text[MAX_TEXT_LENGTH];
public:
	void create(ILI9341 *lcd, uint16_t x, uint16_t y, uint16_t w, uint16_t h, char *text, uint8_t size, State state, uint16_t id);

	void draw(State state);
	void toggle();
	bool isPressed(uint16_t x, uint16_t y) ;

	uint16_t getId();
};
Each button is part of another class, called the UI. This one joins the display driver with the touchscreen driver in order to know what to take from the user (input) and what to give back (display). It also keeps the titlebar and has a refresh mechanism to avoid flickering. It’s constructor also takes a data object:
UI(ILI9341 *lcd, TouchScreen *touch, Data *data)
The data object needs additional work, and its purpose is to transport data coming from the sensors read in the main loop, to the UI for display or process their value, for instance when building charts.
The sensors are handled similarly, where code is grouped in individual classes working as low level drivers. Here’s how the MiCS-VZ-89 interface looks like:
#define VZ89_ADDR (0x70<<1) //0x70 default I2C address


//registers
#define VZ89_CMD_SETPPMCO2 	0x8	// This command is used to send a ppmCO2 value from an analyser to the VZ89 in order to recalibrate its outputs.
#define VZ89_CMD_GETSTATUS	0x9	// This command is used to read the VZ89 status coded with 6 bytes:

class VZ89 {
	void writemem(uint8_t reg, uint8_t value);
	void readmem(uint8_t reg, uint8_t buff[], uint8_t bytes);

public:
	// read the 6 bytes data over I2C
	void readRaw(uint8_t rawData[6]);
	// return CO2 equivalent [ppm] and tVOC equivalent referred to the isobutylene sensitivity unit [ppb].
	bool read(float *co2, uint8_t *reactivity, float *tvoc);
};
This makes it easy to use all components and the code stays clean! In case of problems, we can simply debug just the affected software component, independently. There is even a separate file to define language resources, but it is not complete:
#define STRING_NAME 			"Portable Environmental Monitor"
#define STRING_WEB 			"www.uradmonitor.com"
#define STRING_SHORTNAME		"uRADMonitor-D"
#define STRING_SELFCHECK		"Self check..."
#define STRING_BATVOLTAGE1		"Battery voltage: %2.2fV"
#define STRING_BATDISCHARGED		"Battery is discharged, connect charger!"
#define STRING_STARTUPDONE		"Startup complete %lus"
With all this abstraction in place, the main file is left with defining the components (sensors, lcd, touchscreen and so on), reading measurements and passing them for display, while the UI returns events we can react to, like IDs of buttons pressed. I wasn't hoping to have this on the low level AVR microcontroller, but I'm happy with the current direction.
The Beta source code total 2830 lines:

Connectivity
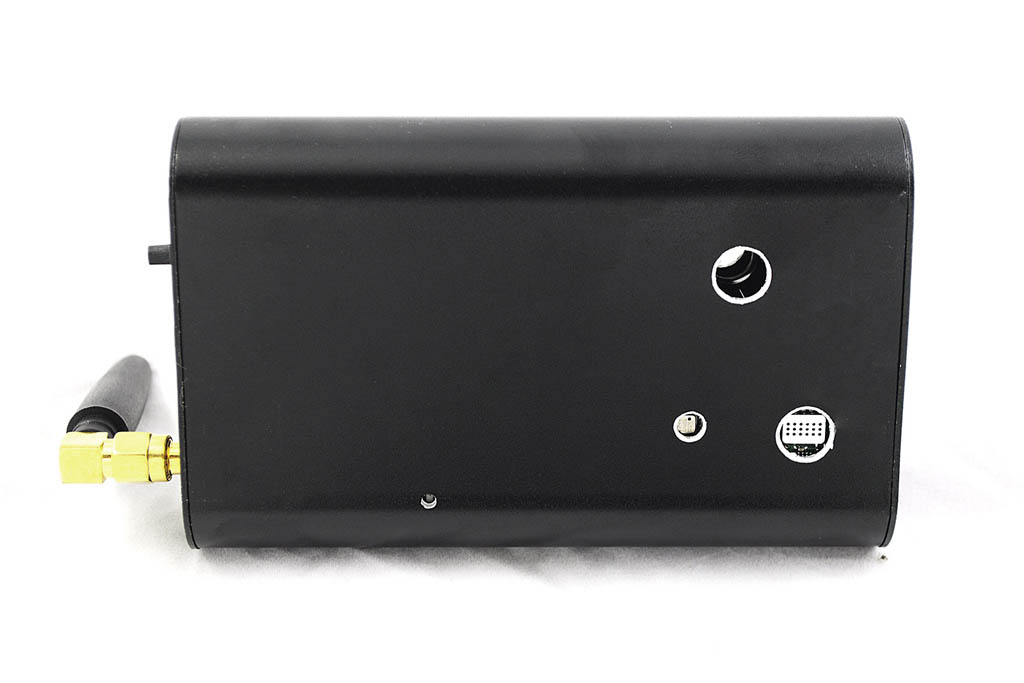
The units are equipped with USB and WLAN. USB is there for several reasons:
1. To allow firmware upgrades via the usb cable
2. To allow terminal access to the uRADMonitor-D . You can connect it to your computer and start a 9600bps channel. Terminal commands are implemented for the Beta as well, such as beep or shutdown (they are more of a test in this phase). But those can be tested easily, just typing the commands in the terminal screen.
3. To get uRADMonitor data. Each minute, the devices send a JSON formatted report over USB that can be parsed easily:
{"data":{"id":"58000001","type":"5","detector":"LND712","cpm":23,"temperature":22.50,"uptime":123,"pressure":100213,"dust":0.01,"co2":400,"voc":10.00,"battery":3.79,"tube":450}}
From previous experience with uRADMonitor model A, there was a lot of community interest to develop and use the data locally, mostly for home automation purposes. Here are a few examples:
http://www.uradmonitor.com/weather-vs-radiation-readings/
http://www.uradmonitor.com/howto-upgrade-uradmonitor-graph-local-statistics/
http://www.uradmonitor.com/topic/new-firmware-enables-rrdtool-graphing/
http://www.uradmonitor.com/topic/include-uradmonitor-in-monitoring-software/
http://www.uradmonitor.com/topic/setup-local-graphs-for-your-uradmonitor/
http://www.uradmonitor.com/topic/uradmonitorx/
So USB will provide one extra option for that.
With WLAN, the units are capable of wirelessly sending data reports to the uRADMonitor server. Hopefully OTA firmware upgrades will also become possible at some point in time.
Beta troubleshooting
If the device doesn't start, connect the USB charger and try again. Keep the start button for a few seconds.
If the device doesn't turn off, press reset. If still on, just press it several times, while also keeping it down for a few seconds.
Pingback: uRADMonitor-D Beta - uRADMonitor
Salut Radu,
As vre sa mai discutam pentru o colaborare. Va las datele mele de contact.
E-mail: solarism@mail.bg
Skype: valerigeorgiev58
Tel:
mob: +359 878 959709
fics: +359 86 816318
Primaria Silistra
Bulgaria.
Pingback: Post Beta hardware iteration - PocketMagic
Pingback: Nominated for Best Cloud/Data Application at CESAwards2015 - uRADMonitor