
EDIT: there is a dedicated blog on this project, here. Make sure to follow it for latest news.
A few days ago I announced my intention of creating my first crowd-funded project, but I didn’t tell you what was it about. Well, I’m planning quite a challenging project – to bring my uRADMonitor to a global scale, and create a network of distributed detectors, with data centralized on one server, so everyone, regardless of location can access radiation related data. With crowd funding, we’ll be able to produce enough of the uRADMonitor units to cover the most important cities and locations, so let’s make this upcoming Crowd funded project a success!
Summary and updates
July 8, 2013: Intro and General specs
The final device should be able to run both as a mobile unit (on batteries) or as a fixed monitoring station (with a waterproof quality aluminum case and connected directly to your home internet router). Besides reading the Gamma radiation levels, it would come with additional sensors, for measuring temperature, humidity, barometric pressure, sky luminosity. To map the data to the real geographic location, the device will have GPS capabilities combined with IP localization (when connected to the internet). For offline use, as a mobile detector, the data would be logged on an internal SDCard, and the content uploaded to the server automatically as soon as a network connection becomes available.
July 9, 2013: The Crowd-funded project
My plan is to finish the final prototype and start my crowd funded campaign (Kickstarter, Indiegogo, Technofunding, etc) where I’m counting on all the support I can get, including yours, readers of my blog! Up to this point, using my private resources, I’ve been able to fund my own research and prototype developed, and I will continue to do so, but additional funding can help speed up the process.
The idea behind this project is to help people gain access to radiation measurement devices but on a global scale, by providing the uRADMonitor devices that anyone can install simply by plugging in the internet router network cable and a DC power supply. The data is then centralized, and the server located at www.uradmonitor.com allows free access to the data collected. With a few clicks you’ll be able to see the levels in your city, or any other place. So easy!

The device also works as a data logger, especially when used as a mobile dosimeter, storing on an internal SDCard, GPS location and the environmental readings for Gamma Radiation background, temperature, humidity, pressure and luminosity.
All you need to do is get your own uRADMonitor device, place it outside or use it as a mobile detector, and the data is logged and sent to the server as soon as you connect it to the Internet. Then in front of the computer see your own readings or data collected by others. Not only a Geiger counter, but a powerful environment surveillance tool that builds a network of readings mapped to the entire Earth!
I decided to make the construction log publicly available, so others can see the story of what it takes to make this project happen:
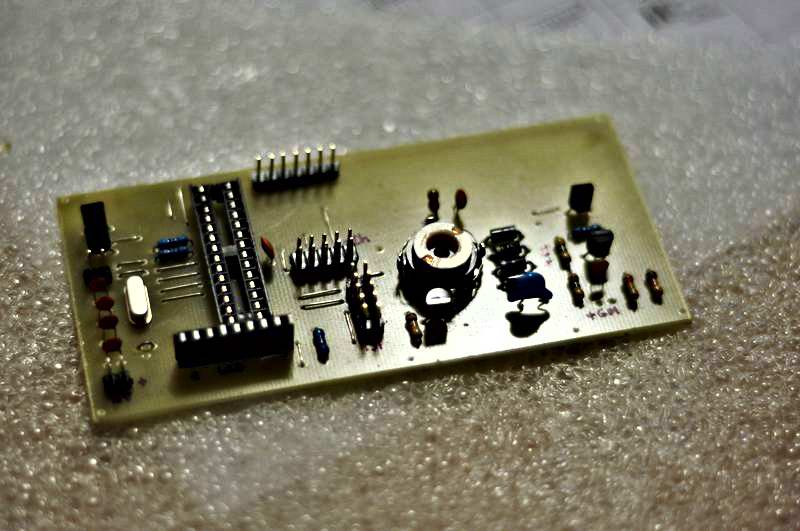
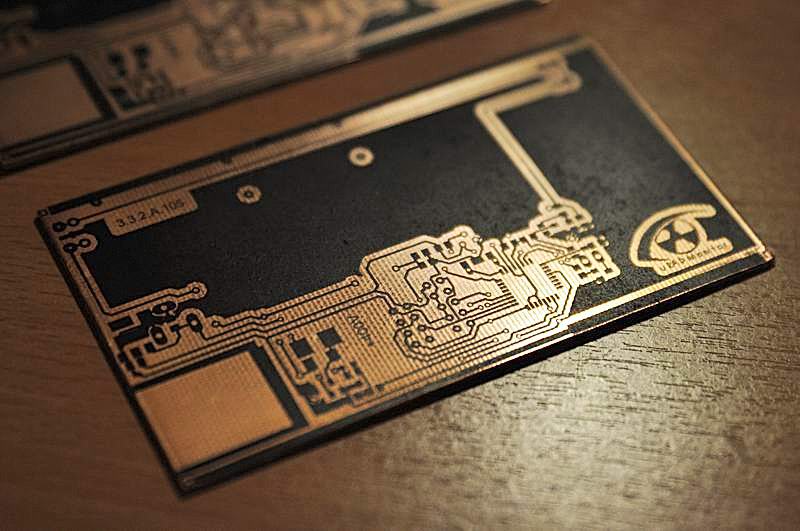
July 10, 2013: The first prototype
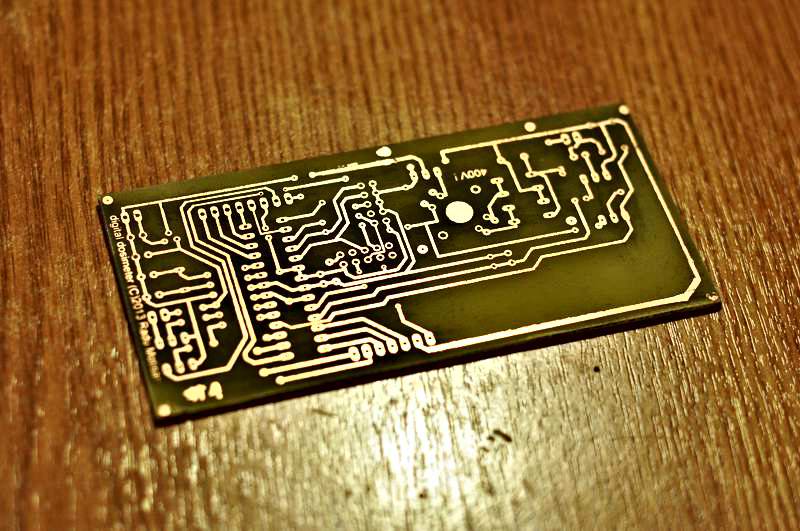
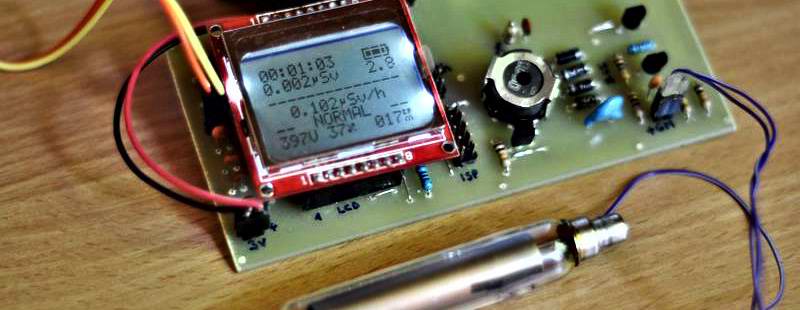
At this point the first prototype (3.3.2.100) is ready: the microcontroller board, the counter circuit, the 400V regulated inverter, the display (84×48 pixels, graphical display with backlight).
I wrote the software to take the maximum out of the 84×48 display: special characters have been added (defined with 0 and 1 like in the the old BASIC days) for micro symbol, CPM, radiation sign or battery icons. Printing text, there’s a total space of 14×6 characters: first I show the internal time (hh:mm:ss), the battery level (4 indicators for charging, full battery, discharged and empty), the accumulated dose registered since the device was powered on (measured in micro,mili or Sieverts, depending on the value size), then there’s the battery value in volts, under the battery charge symbol. The third line shows the equivalent dose (measured in micro,mili or Sieverts per hour, again, depending on value size, the software does the switch automatically), a text description of radition level with 4 states (LOW, NORMAL, HIGH, DANGER) set to <0.10uSv/h, <0.20uSv/h, <0.30uSv/h and more than 0.30uSv/h for danger indicator. Finally the last line shows Geiger tube voltage (regulated to a constant of 400V +-5V), the inverter duty cycle (aprox. 34%) and the CPM, or counts per minute (measured as CPM, Kilo CPM or MegaCPM, depending on value size).
July 12, 2013: Ra-226 source test video
Here is a video showing a high count detection test, using the vintage 1B24 TR Switch radar tube, containing a small amount of Ra-226:
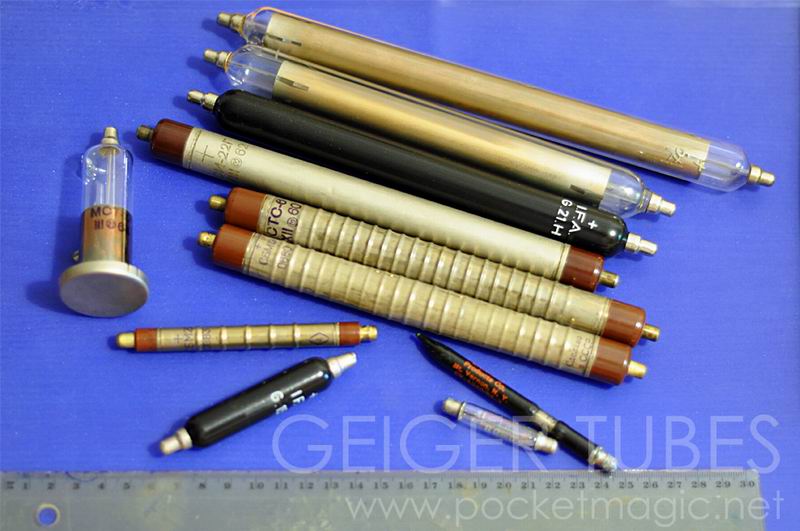
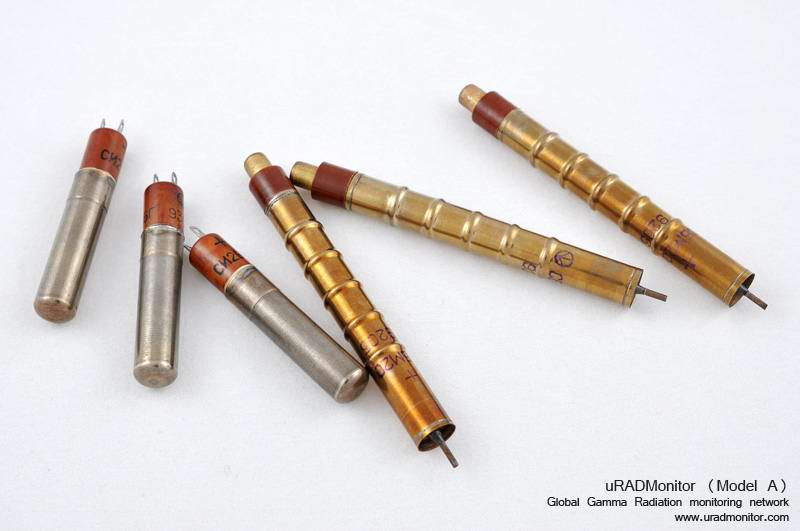
July 15, 2013: Geiger tubes comparison
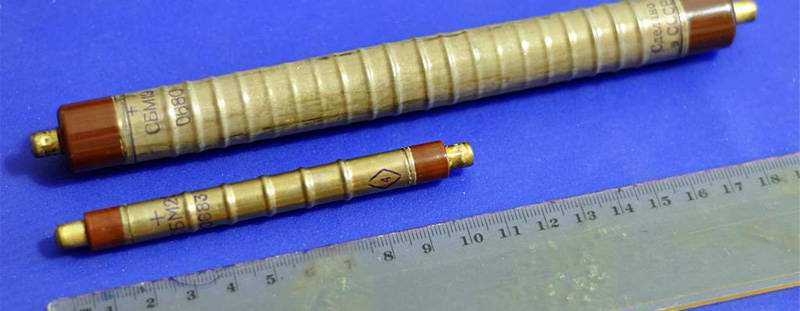
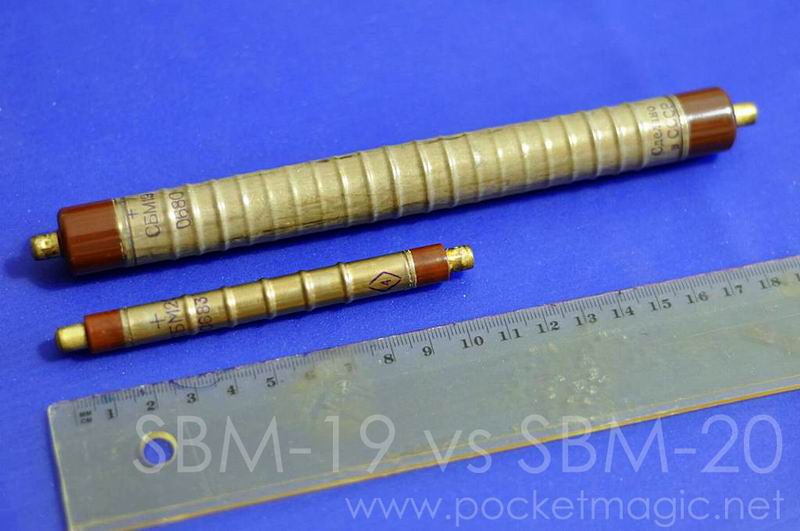
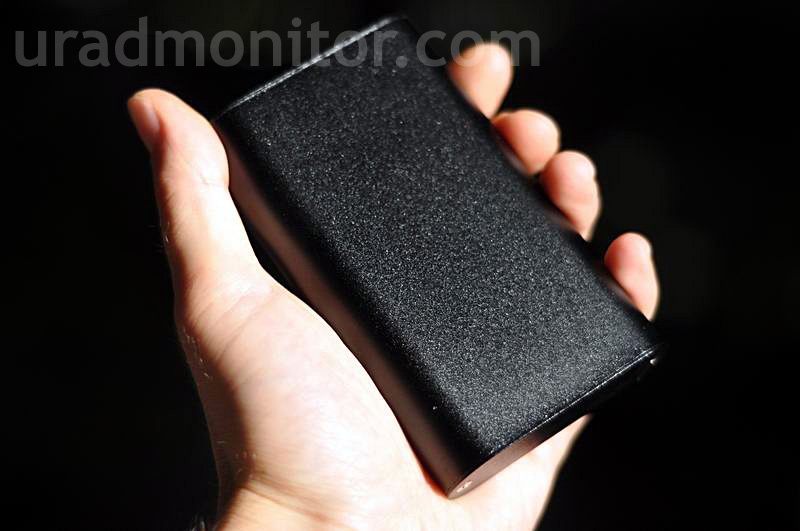
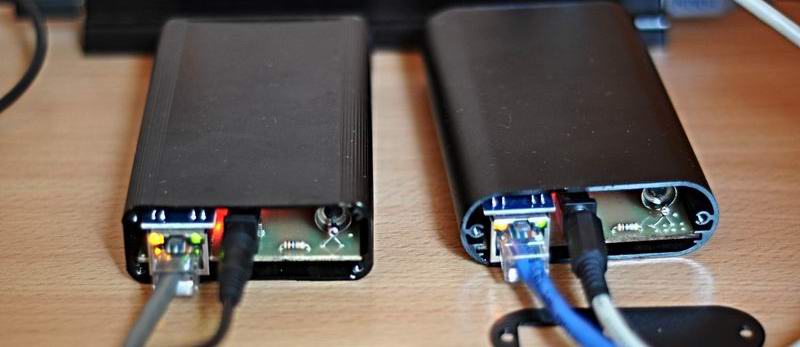
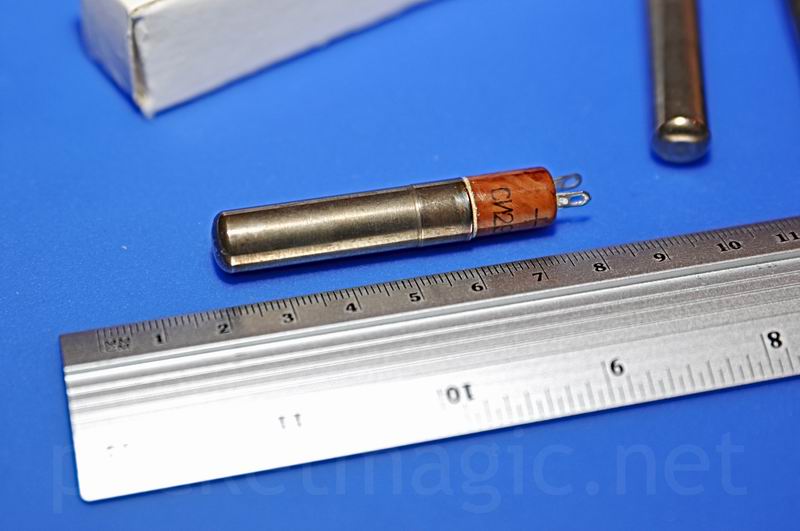
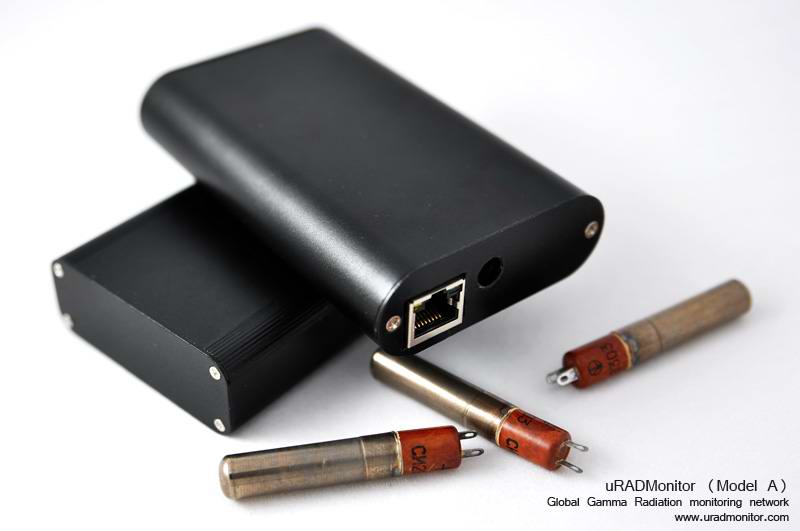
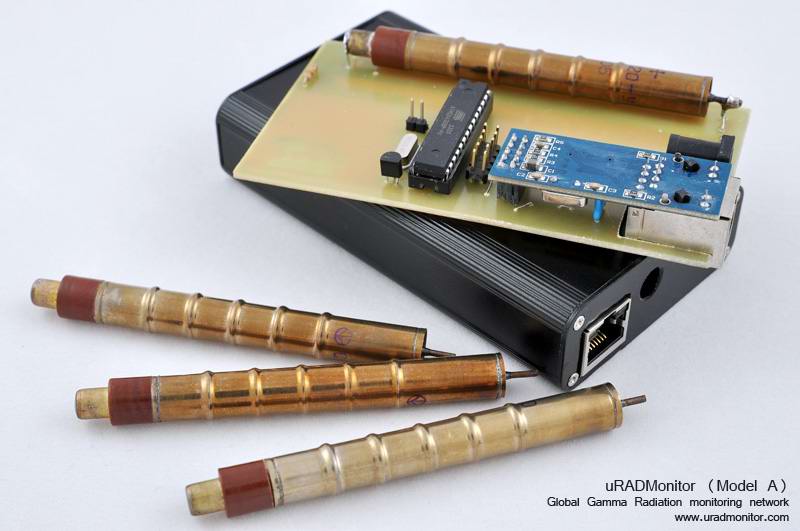
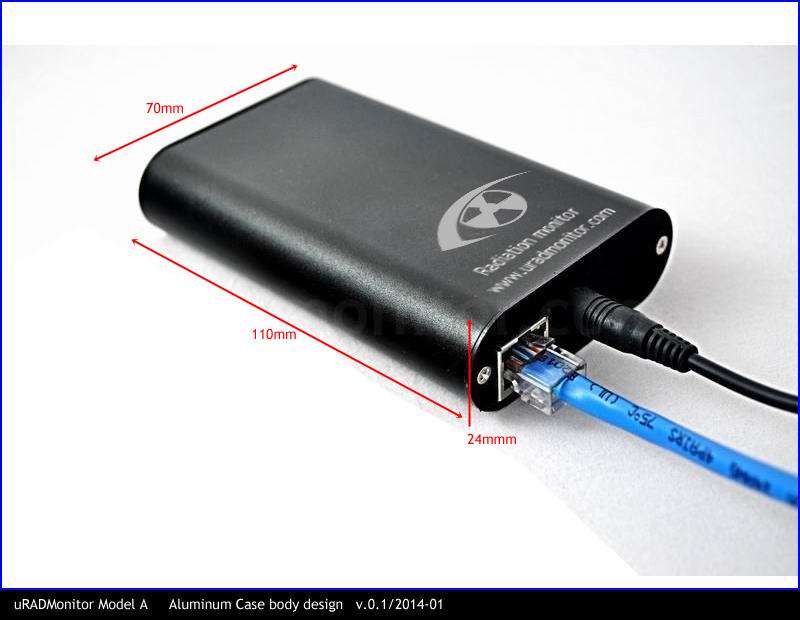
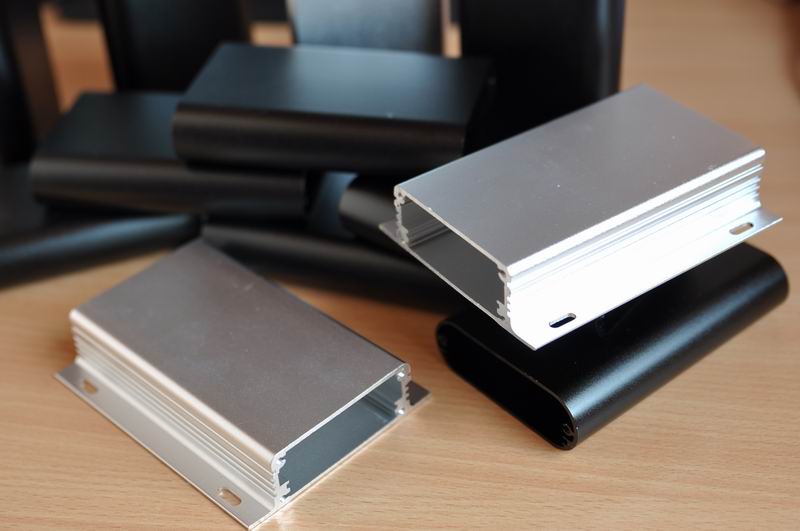
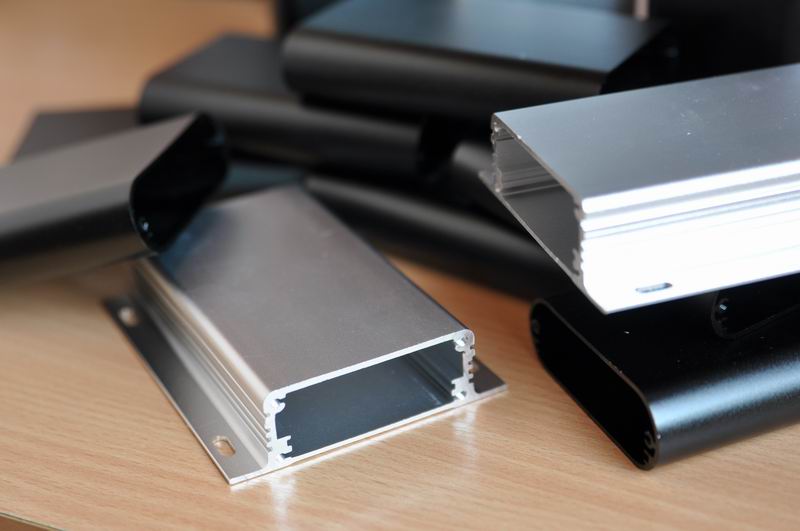
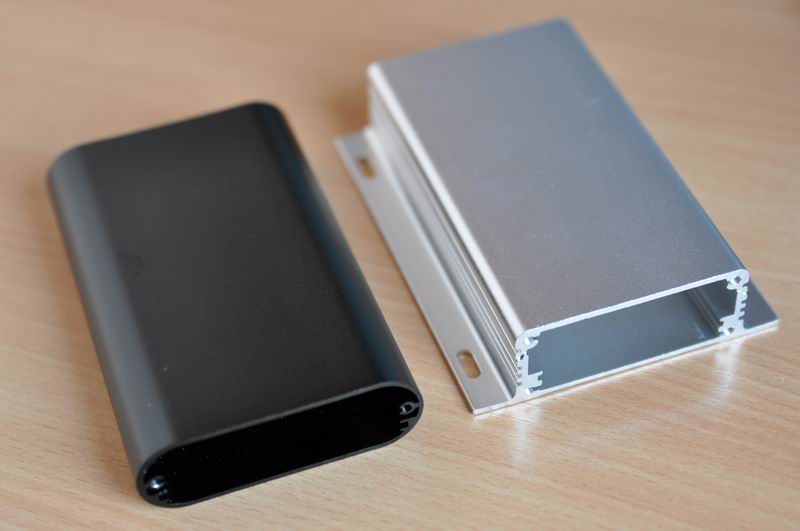
Having two devices in one – portable dosimeter and fixed monitoring station, certainly complicates things. The former needs a battery, the station will go for DC source. The portable device must be small, the latter can be bigger in size. Is this important? Well, let’s take the size into account: to be convenient for the user to carry it, the portable dosimeter should be no longer than 110mm and fit the black case, as in the picture above.
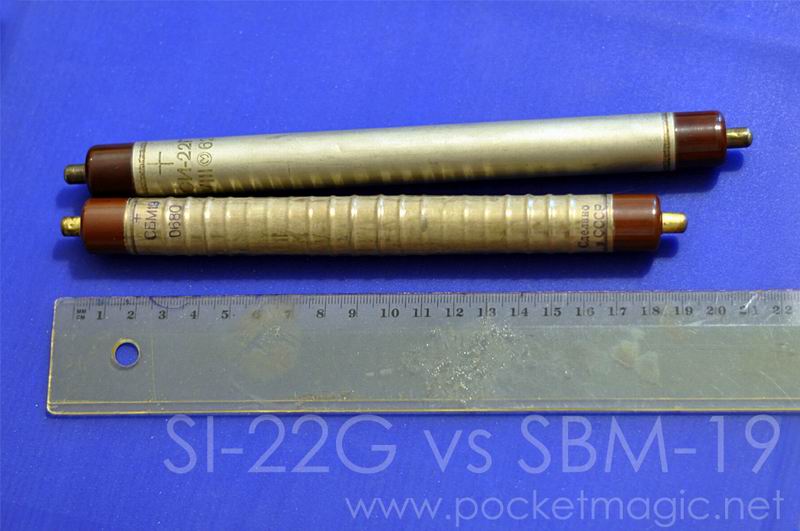
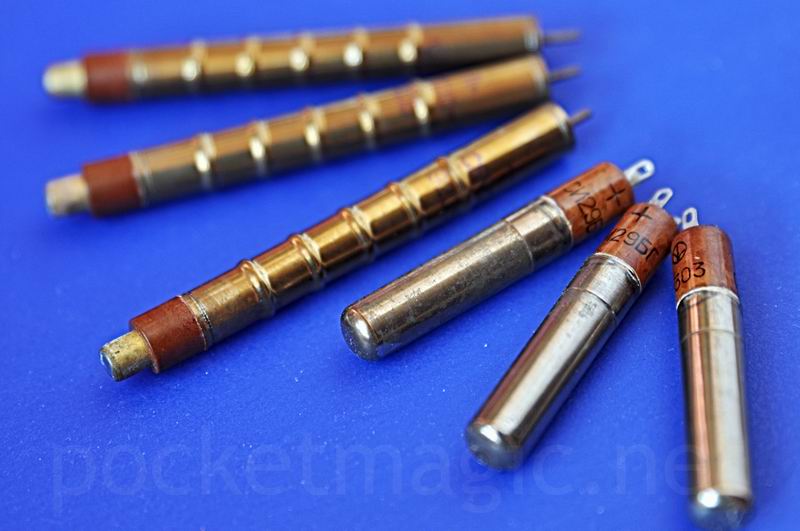
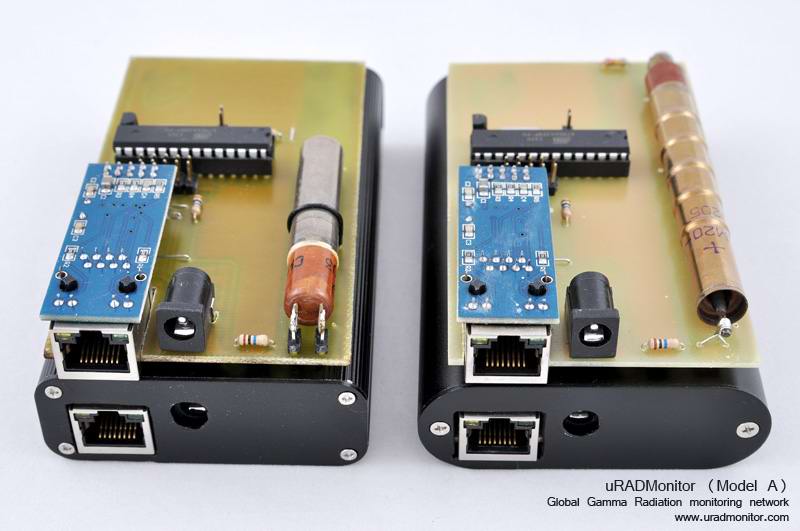
This implies using an appropriate Geiger tube, since these guys are coming in given sizes, and must have everything else match them. A good choice would be the SBM-20, but this is less sensitive than the bigger SBM-19, used in my first uRADMonitor variant . Background counts for SBM-19 is at 80cpm, while the SBM-20 barely touches 20. For short term readings this might result in unwanted variations from the true environment radiation dose, but would not be an issue when integrating the data over a larger time interval (a few hours or so). SBM-19 is 19cm in length, while the SBM-20 is only 11cm:
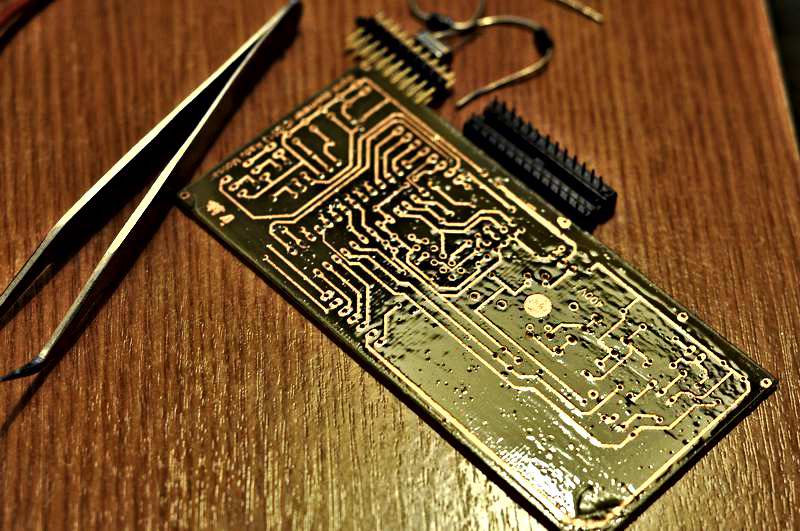
July 28, 2013: Designing the tiny 400V inverter
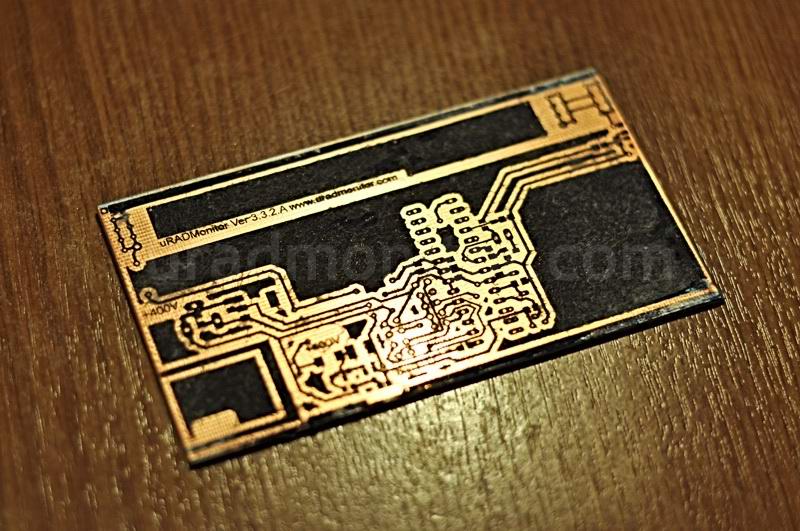
I’ve been busy designing the next prototype. The target is to make the circuit small enough to fit the aluminum case I opted for. I know that this is just another constraint that complicates things, and that the case should be amongst the last things to opt for, according to the final board, however as stated previously, this device should also be portable – this is why the case should have a reasonable size as well:
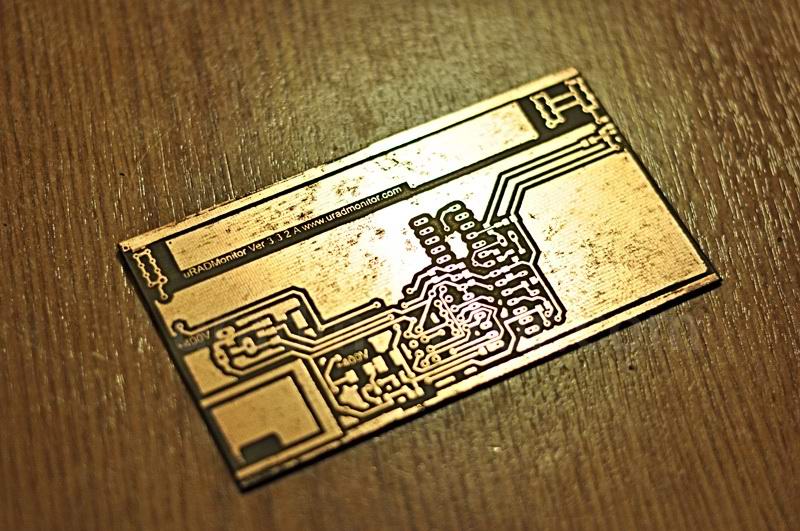
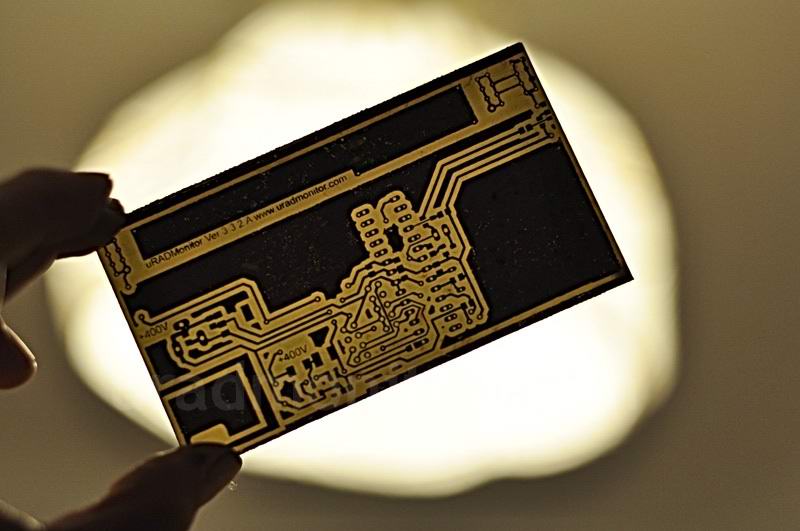
The circuit above (prototype 1) fits nicely, but it doesn’t leave much space for batteries, GPS, Ethernet module and the SDCard storage module. To minimize, this new board will be created with SMD technology.
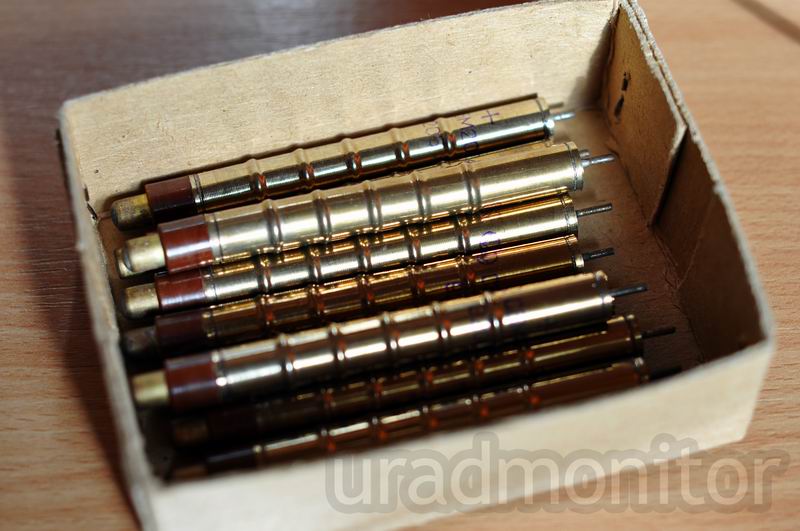
Going for SMD, everything is nice and easy, except the 400V inverter (for the Geiger tube). Instead of using the ferrite transformer, I have to design a boost converter (step up converter) that uses a choke! Just compare the pics below to get the idea:
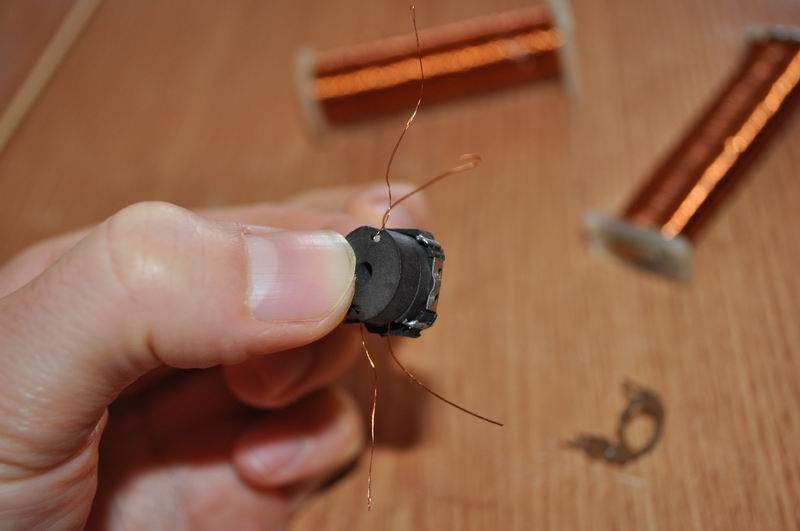
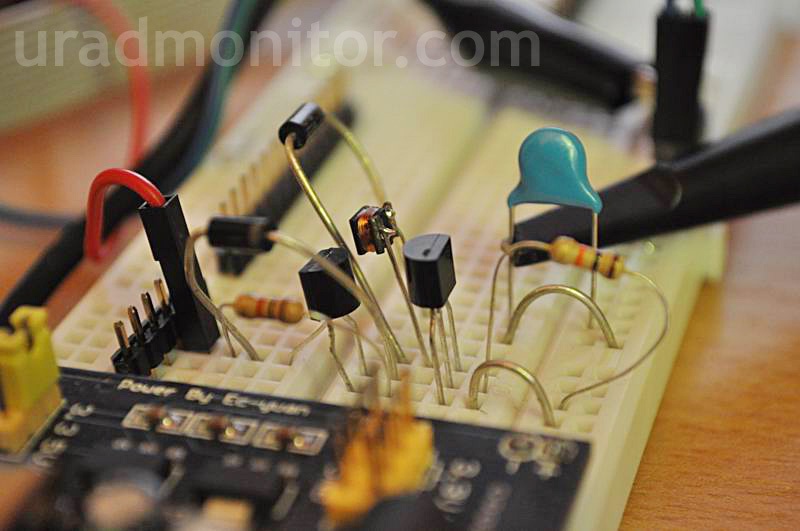
The choke, visible in the second photo is the tiny coil between the two black transistors placed on the breadboard. With this setup I am trying to get something close to 400V from only 3V of input voltage.
The simple Boost converter setup doesn’t provide enough output voltage (and it’s not a big surprise as according to the literature, a certain maximum transformation factor is indicated). The simple boost converter (VAR-1) will only produce something close to 100V only, so far from the 400V required for the Geiger tube. But with the second variant (VAR-2), that uses a second transistor (T2) to discharge the base of the main switching transistor (T1), I got better results:
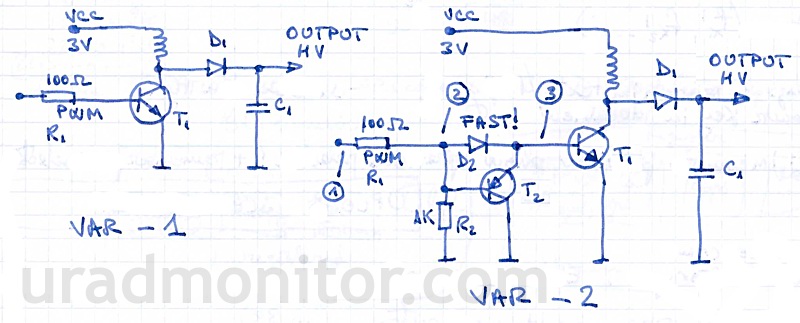
But the discharge transistor (T2) also changed the shape of the PWM signal considerably. I can no longer rely on the original PWM oscillation parameters . Normally a frequency of 10-20kHz is perfect for the ferrite cores I use (both chokes and transformers). To exit the audible spectrum completely (and make sure the device doesn’t produce annoying ultrasonic sounds), I usually go for a minimum of 17KHz. The signal looks clean, a nice rectangular signal as expected. But with the VAR-2 modification, things change. Here are the oscillograms, measured in point 1 , 2 and 3 (points indicated on the schematic):
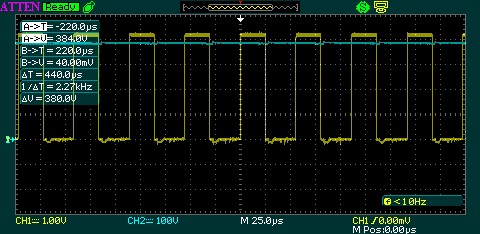
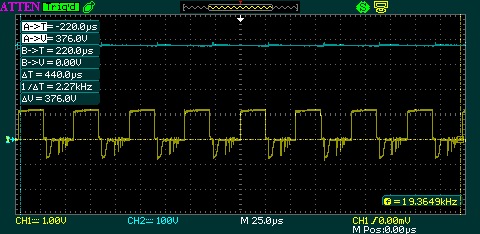
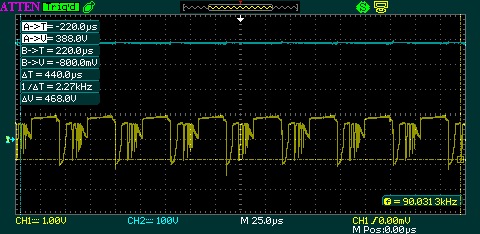
So instead of setting the microcontroller code to generate a 17KHz signal, I will probably go for strange values like 100KHz, actually resulting in a nice output voltage that is close to 400V. The last image already shows the CH2 (in cyan) reaching the Geiger tube voltage interval (388V, more than enough to run the SBM20).
This was a minor change in the booster converter topology resulting in higher voltage output. I also had to use a different T1 switching transistor (this is highly critical), as not any would do. Finally it now works, time to finish this second prototype, but this time with SMD components.
July 30, 2013: Wireless connectivity
Several people suggested that adding WLAN/Wifi capabilities to the uRADMonitor would be a great feature to have. And indeed, a data radio link is preferred over having to install Ethernet/UTP cables all around the place, or to have to take them outside or where the monitor is to be mounted. There are many obvious advantages, but as expected, there are also a few issues:
– a WLAN 802.11b/g Module consumes additional power, where we are already at the limit having so many modules and features
– Configuring the WLAN link would require data input at least for the security key (WEP/WPA): a minimal alphanumeric keyboard, or a bluetooth link to a smartphone – but this over-complicates the entire project.
A better alternative seems using a RF transceiver or even a simple RF module pair, like the FA1000A, presented here.
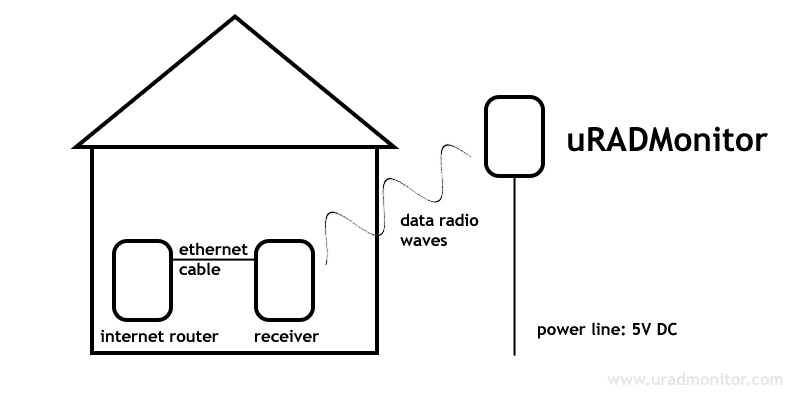
The uRADMonitor would send the data wirelessly over the RF link, to a receiver connected by cable to the internet router. So instead of having to install two cables, there could be a single power cable, and a secondary module to act as radio receiver/gateway and redirect the data to the internet router.
August 01, 2013: Offline SDCard logger
For data logging I’ve considered using either an EEPROM module or a SDCard. The latter has many advantages like huge memory capacity and compatibility with PCs, so you would be able to take it out of the uRADMonitor and see the data on your PC.
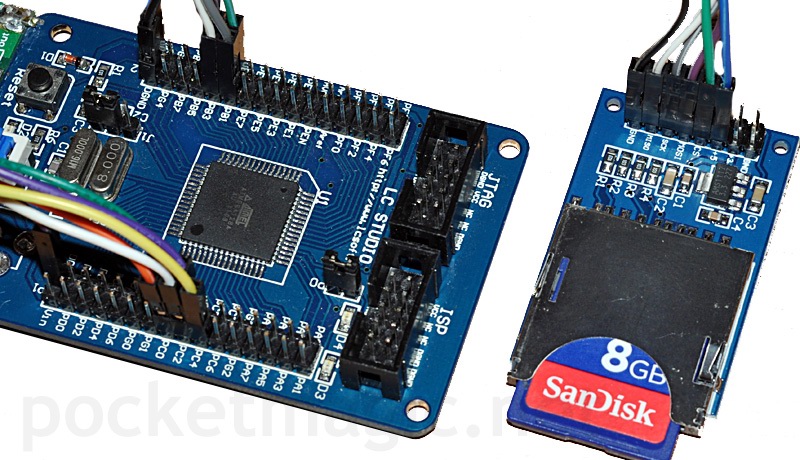
I did some progress on this, and the SDCard module is ready to accept sensor data (radiation/gps data logger for portable use). More on SDCards and microcontrollers, here.
September 3, 2013: SBM-20 Geiger tubes
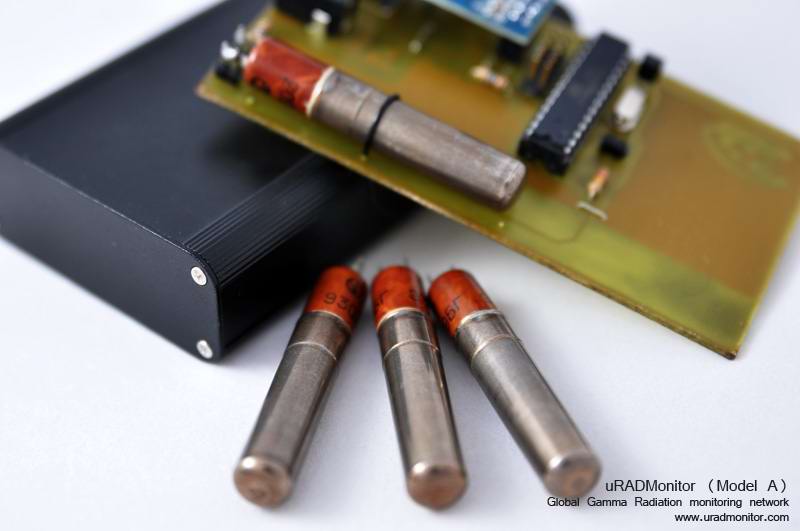
I had some very nice progress developing the next prototype. After waiting for some modules to arrive from China, they finally did, and also the first batch of Geiger tubes, of type SBM-20:
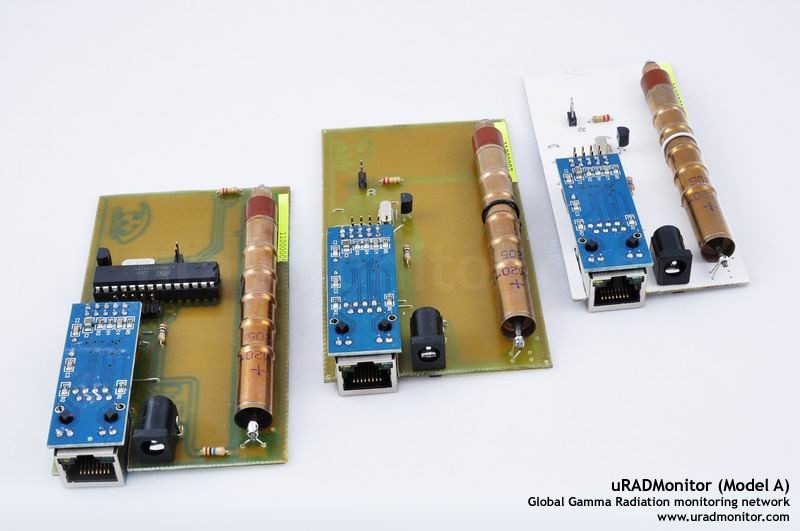
October 3, 2013: Three variants: A, B and C
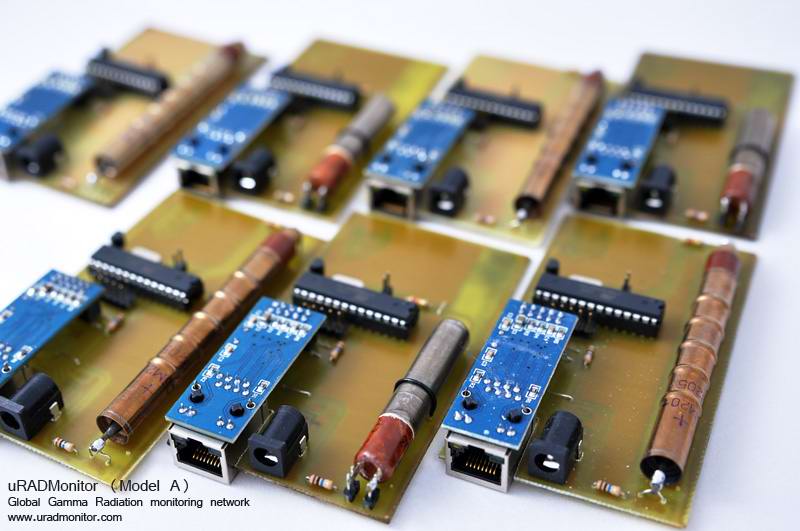
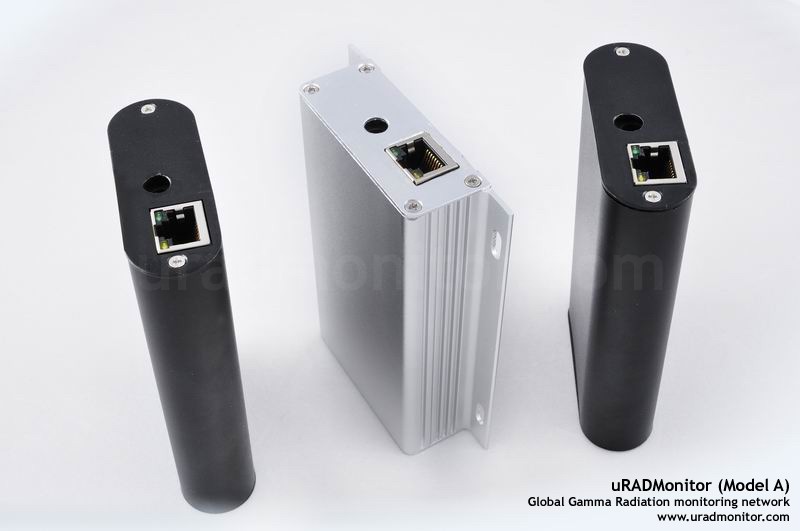
I have decided to create three different uRADMonitor devices, that will be part of a single, global radiation surveillance network. From simpler to more complex these are:
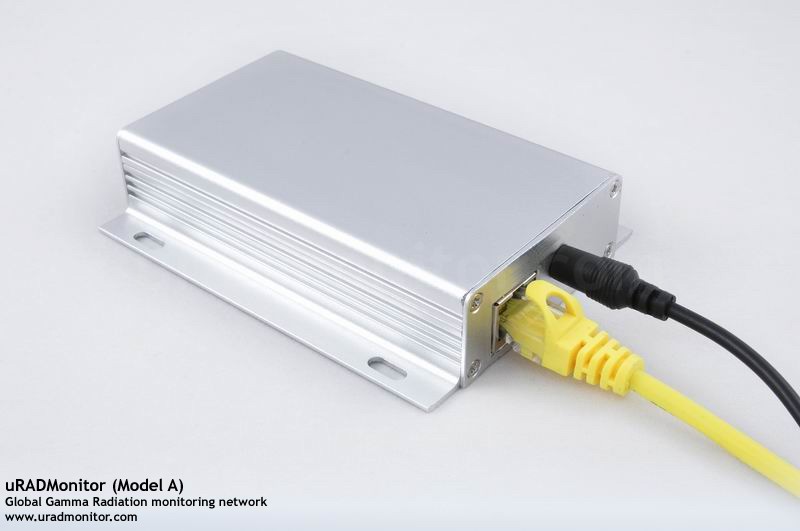
– Model A: a small compact detector, this device contains a Geiger counter (SBM-20), a temperature sensor and a network interface. Encased in a small aluminum box, exposing only the DC power connector and the Ethernet port, intended as a fixed monitor. It’s main advantage is the relative low production cost, while offering continuous radiation surveillance. The radiation detector is built upon a SBM-20 tube.
– Model B: the same compact size as the above, while also offering a LCD and a built in battery for remote operation. Model B can be used both as a monitor (when connected to the network via Ethernet cable) and as a mobile dosimeter showing the radiation levels on the LCD. Data is centralized only if the device is connected to the network (via the Ethernet cable).
– Model C: the most complex uRADMonitor design, features the same LCD as the previous model, but comes with more features and sensors: a GPS unit for mapping radiation data to location and also for standalone use as a GPS Tracker, a SDCard slot for logging the data when a network connection is not available, a wireless network connection to avoid installing complicated Ethernet cables – only DC power is required. Model C logs data to SDCard when Internet is not available and then uploads the data automatically when a connection becomes available. The wireless connection is via 2.4GHz radio waves to a local receiver connected to the Internet router by cable: so you can mount the uRADMonitor station outside, and have it upload data wirelessly to a receiver placed inside and connected via a short Ethernet cable to your Internet router. Very much like in this diagram.
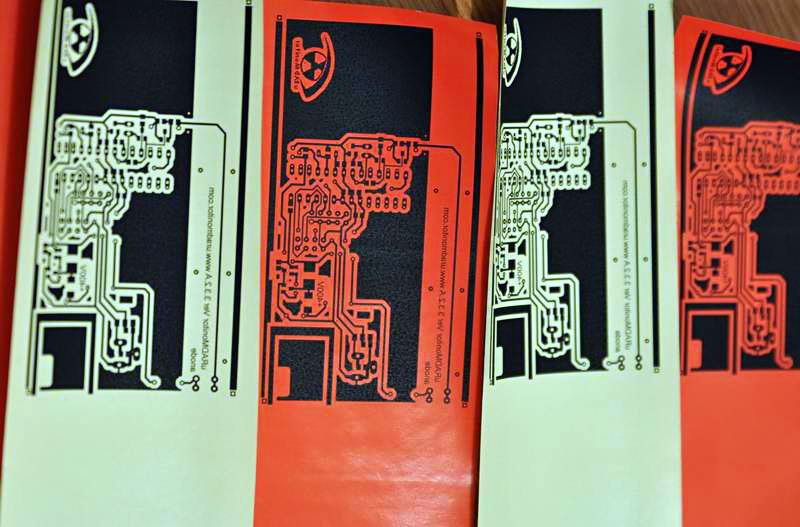
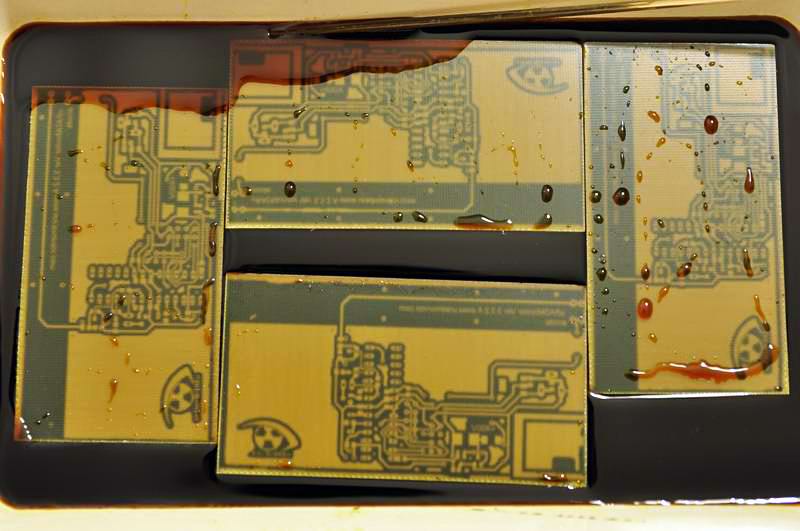
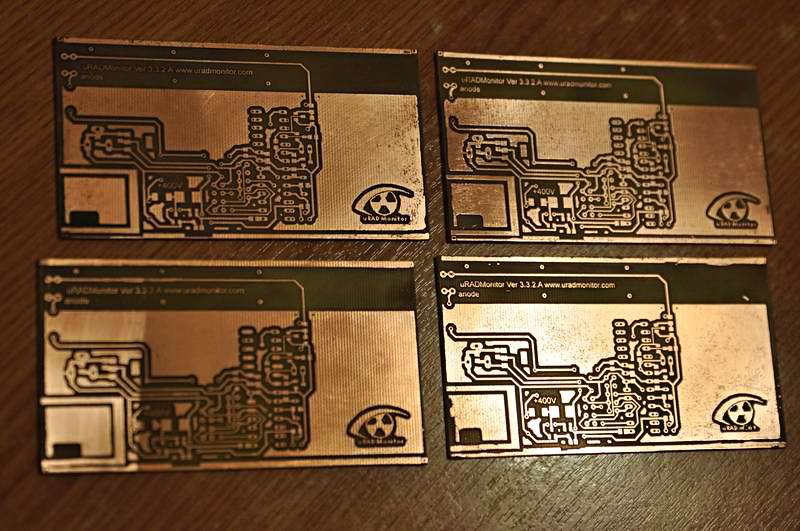
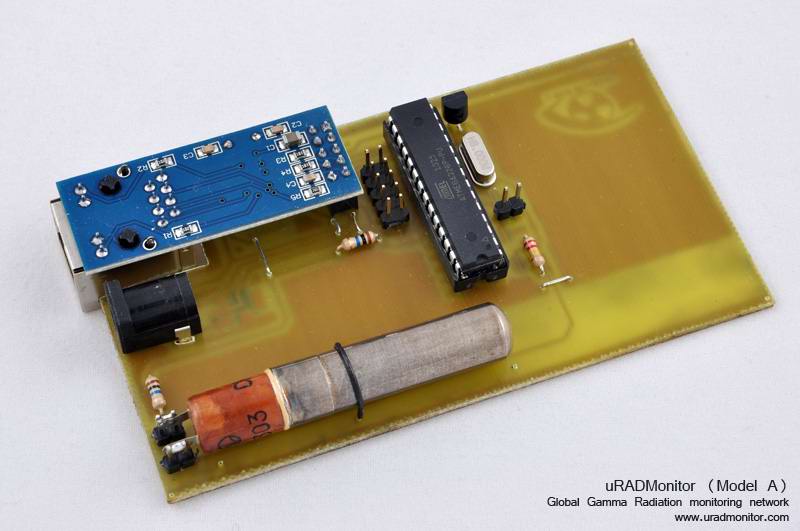
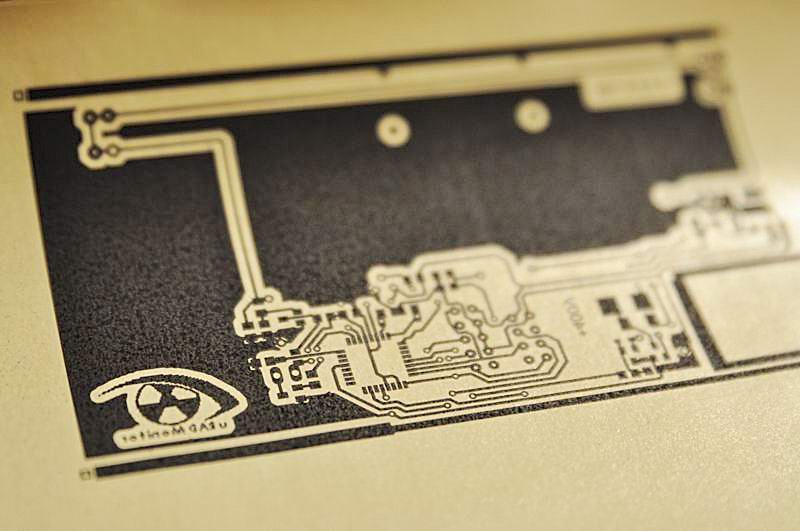
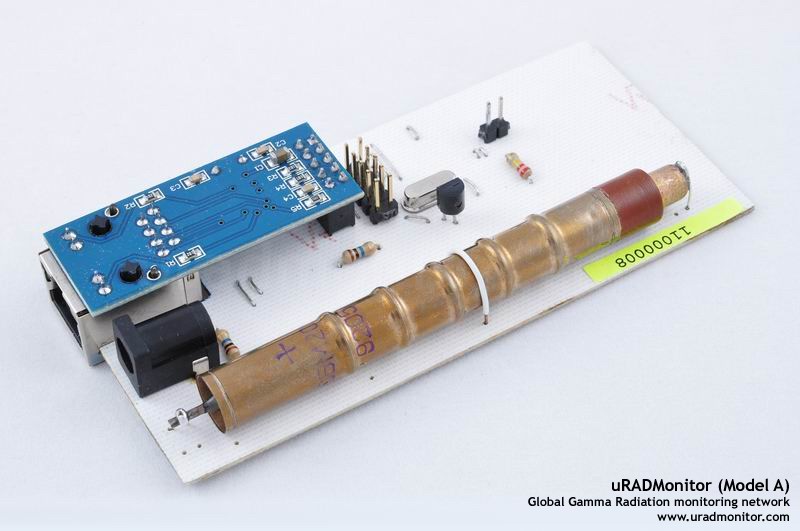
For now, I completed the PCB design for the uRADMonitor Model A.
Next is the software design, and finishing the aluminum case.
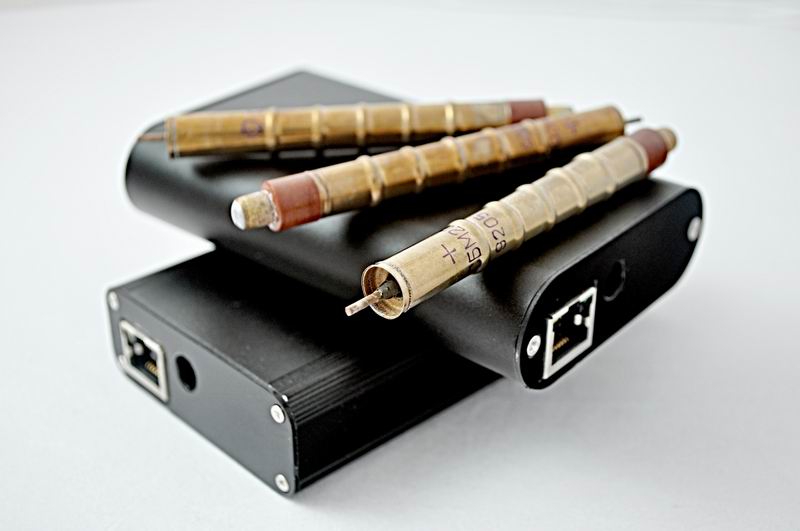
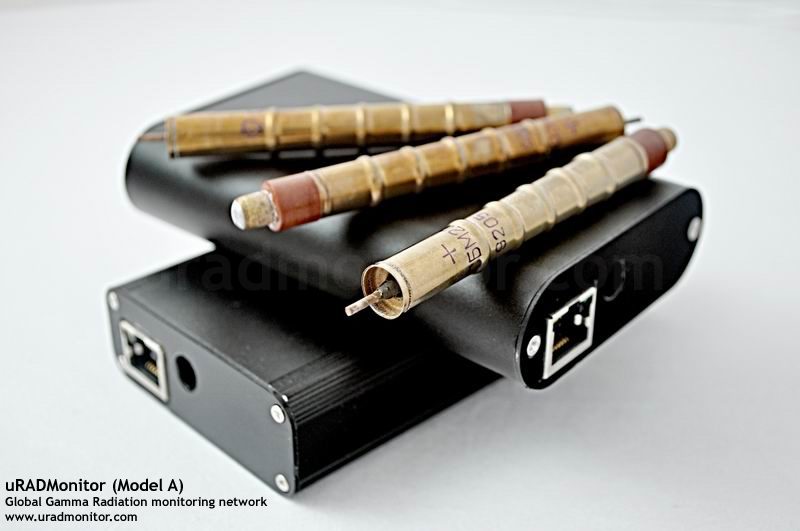
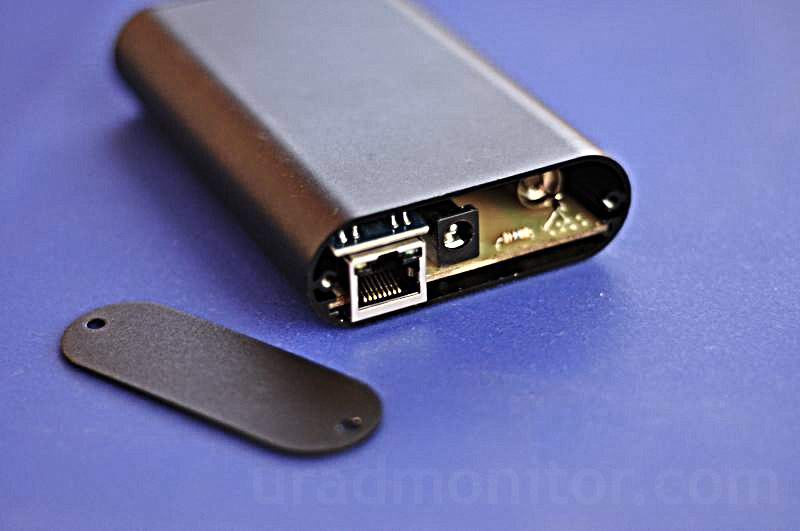
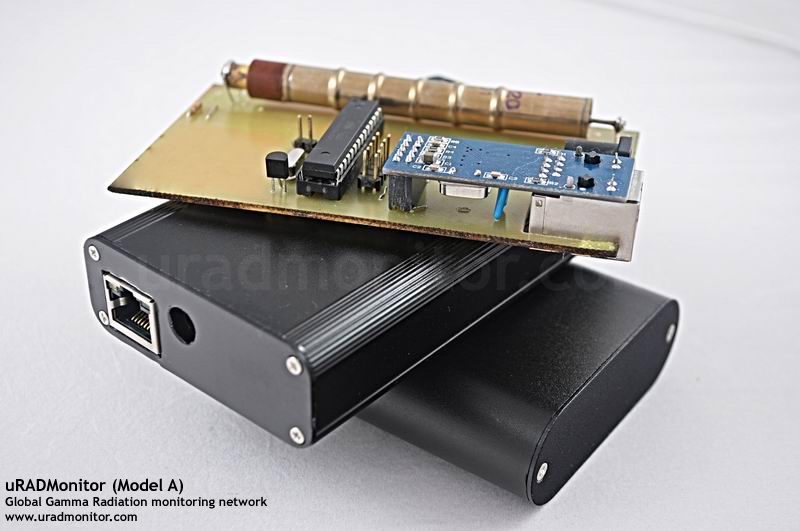
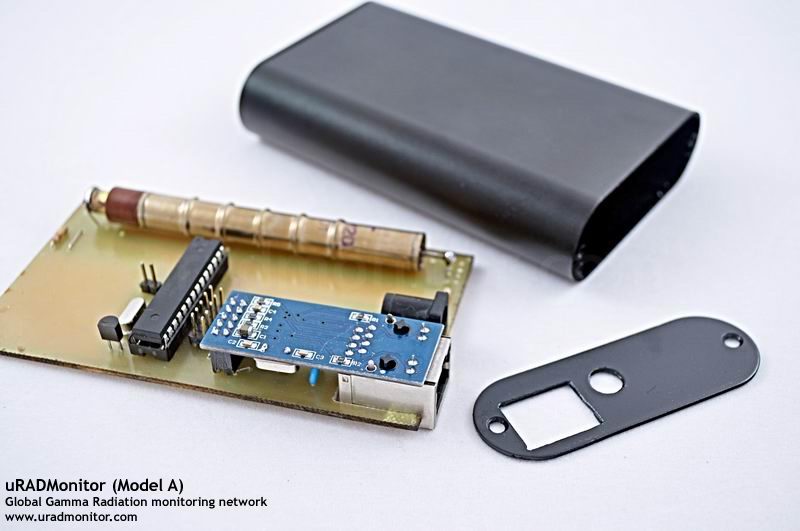
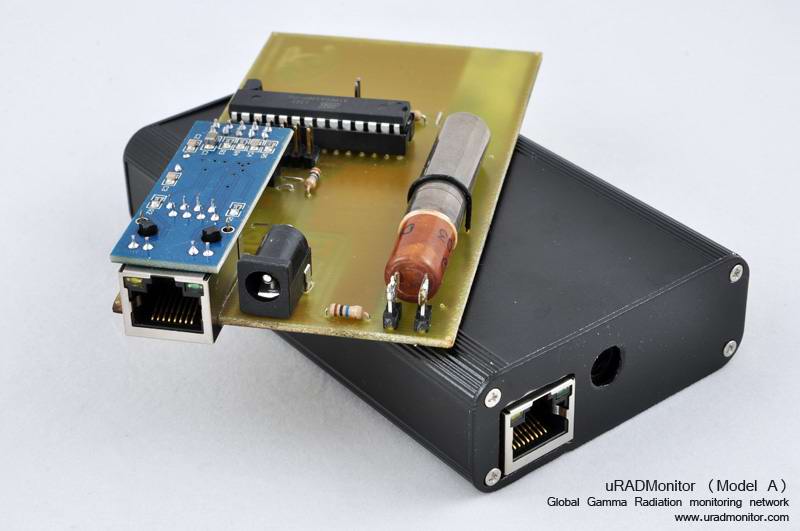
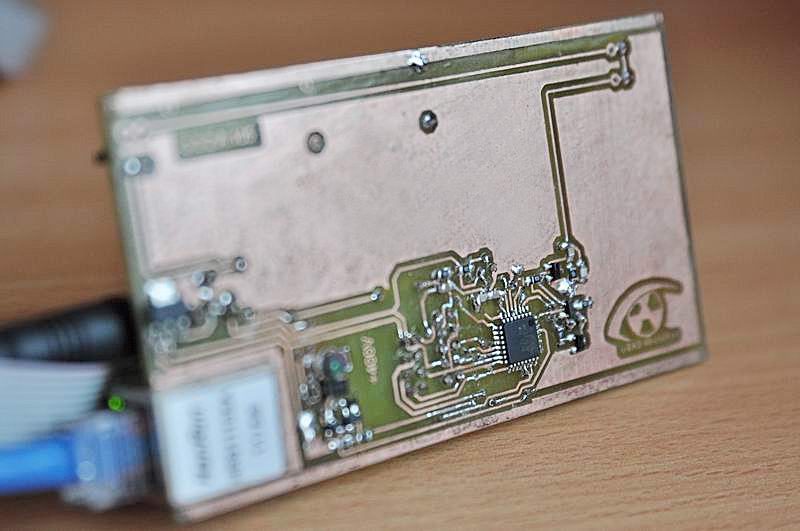
October 4, 2013: Model A Ready!
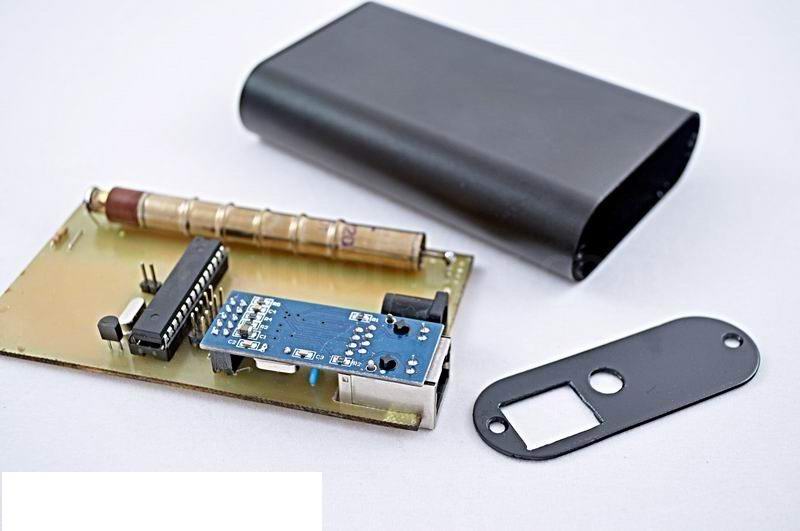
The Model A first prototype is ready. The board fits the case perfectly and it slides on the side rails when taking it in/out. The software is also close to the finish point and the device is already sending data to the uRADMonitor servers. I am happy with the size of the device, and the rugged feeling given by the robust aluminum case.
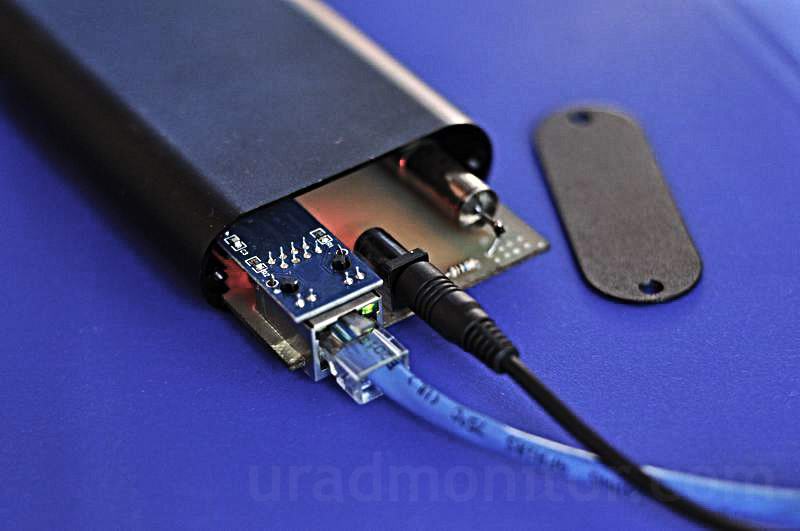
For this device I developed a tiny 400V inverter module, all with SMD components including the ferrite choke. No need to wind any other coils with hundreds of turns for ferrite core transformers like I did before. I’m sure this will be a huge time saver.
Simple and elegant, the board has plenty of space for adding all the extra features in Model B. Yes, the same case size will be used. Model B will also feature an LCD display.
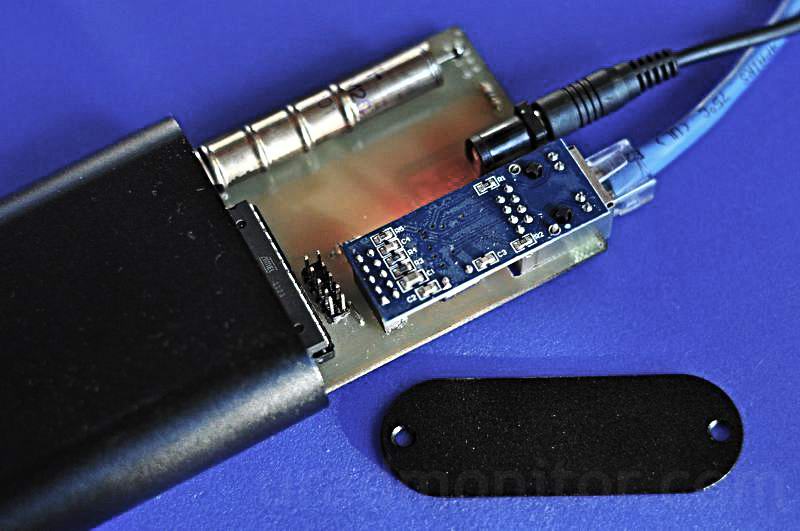
The second picture shows the inverter module, just at the right of the Ethernet connector, on top of the red light background.
October 5, 2013: Completing the software
Now it’s the time to complete the software for uRADMonitor Model A. First go the timers, the PWM (for the inverter), the temperature sensor code and the Geiger tube pulse counter, taking into account the microcontroller frequency set by an external quartz crystal of 8MHz.
For the inverter, I am using one main switching transistor driven by PWM, and controlled with a discharge transistor for sharper pulses and higher voltage. This was explained above already – I will not repeat it. This part of the circuit is entirely done with SMDs, so I get a lot of functionality in such little space. Given the SBM-20’s working interval of 350-475V, my plan is to drive the tube at 376V.
In order to find the inverter’s best combination of parameters (frequency and duty cycle) , I did some comprehensive measurements and put them into a chart:
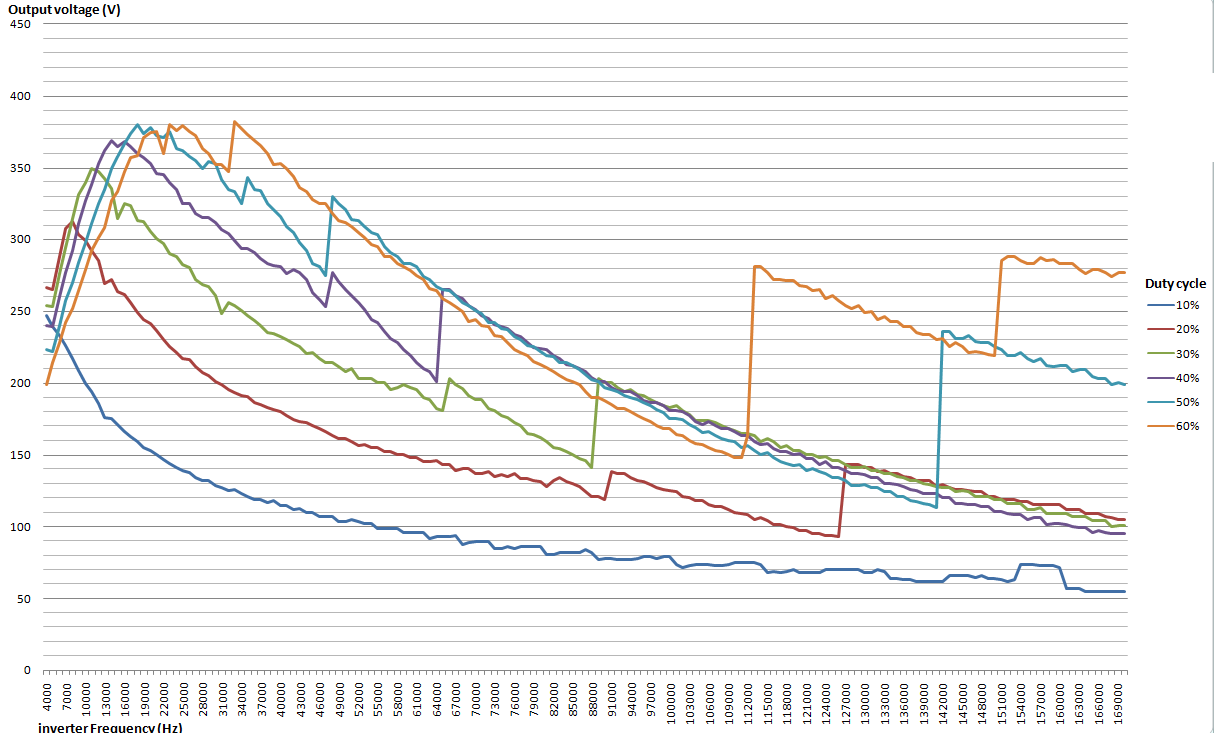
The complete list of values is available in this PDF document: inverter_performance
Given the results, the best inverter settings seem close to duty cycle 50%, but don’t forget I am using a discharge transistor – as a result the main switching transistor is ON for only a fraction of this.
The code makes the duty cycle auto adjustable for the target of 376V so we have a regulated voltage applied to the tube. My frequency of choice is 19KHz, way above the ultrasonic audible threshold. If you look at the chart, my choice of parameters corresponds to the cyan peak (that hits little over 380V).
I also noticed the interesting rectangular shapes formed by the different combinations of parameters, that are shifted both in amplitude and frequency. Maybe someone can explain this phenomenon – just use the comments section if you have any idea on it.
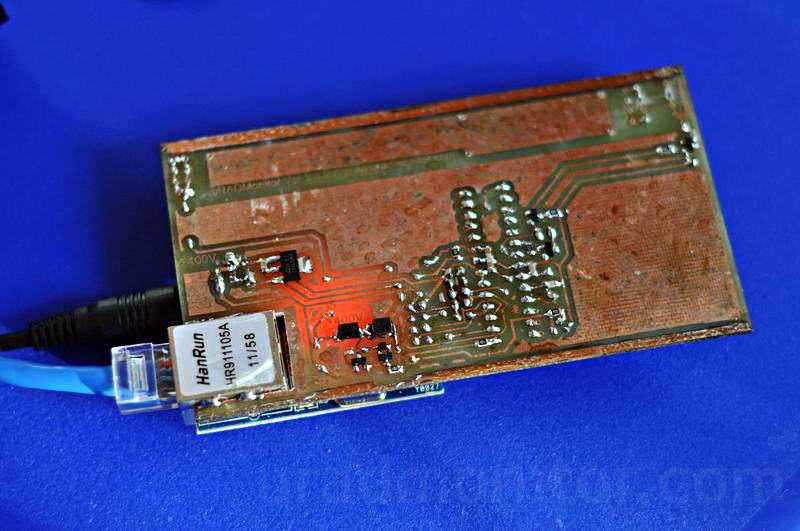
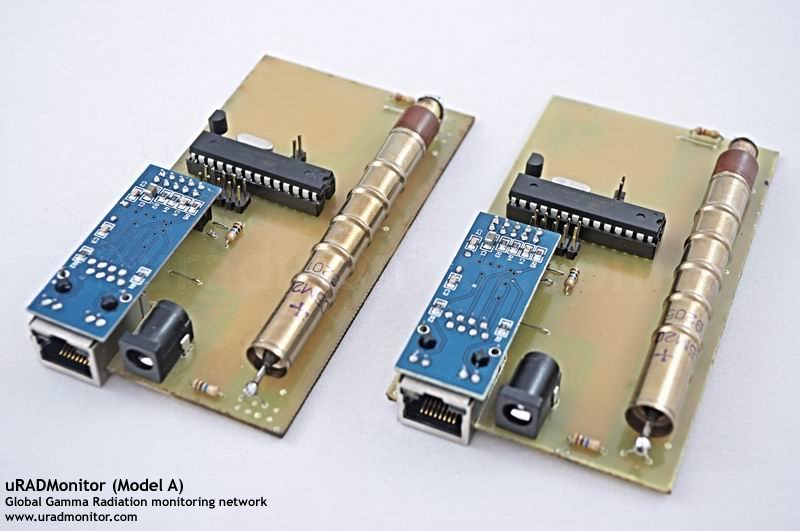
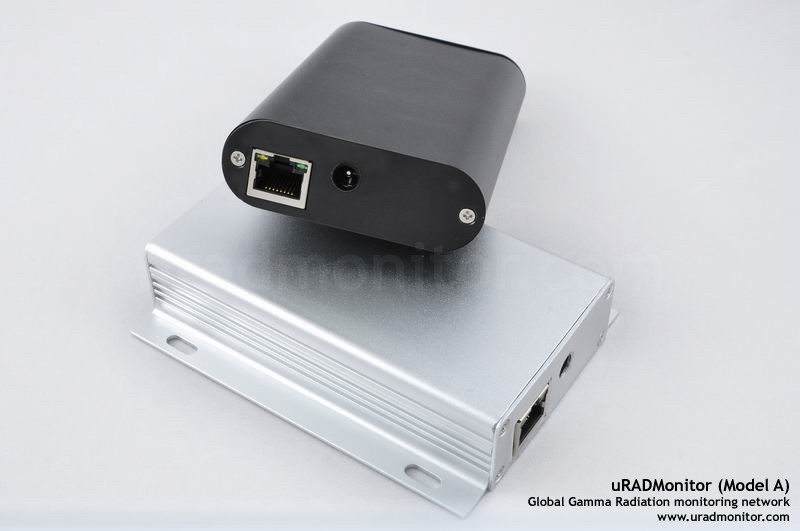
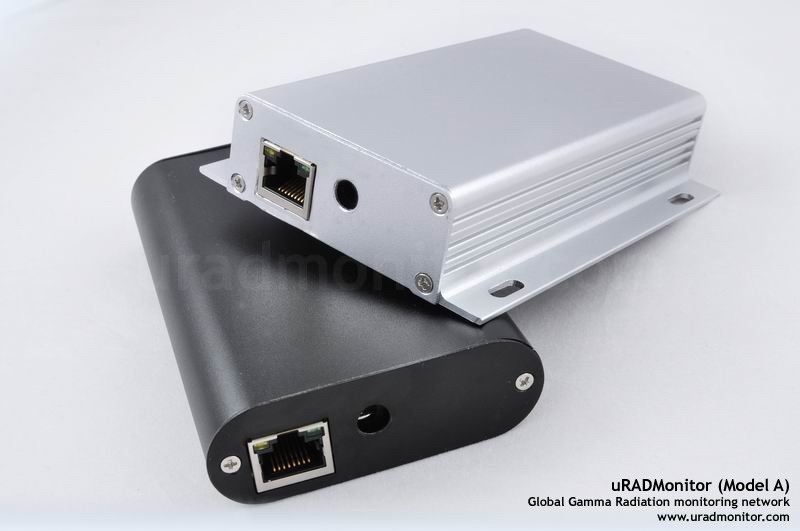
October 8, 2013: Rugged aluminum cases
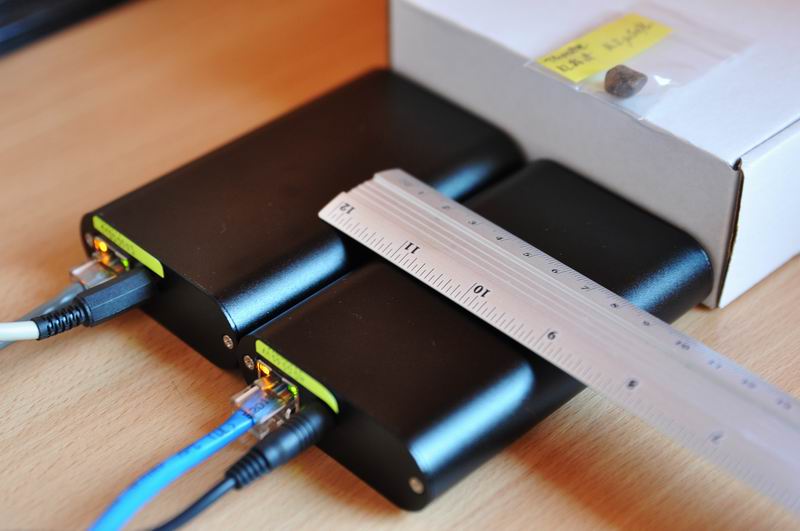
I now have completed the second unit, and have the first two units of the uRADMonitor unit Model A ready. The last hardware job was to complete the case lids to make space for the two connectors, the Ethernet and the DC plug. For the next units, a chinese manufacturer will take care of all the details so these two first units are entirely hand made (pcb+smd soldering+case power tools work). I am quite happy with the result and the robustness of this product so far.
The next few days I’ll run tests for checking the quality, the stability and the behavior when exposed to various sources of radiation. Adjustments in software will be added where required. Here are a few photos I took today:
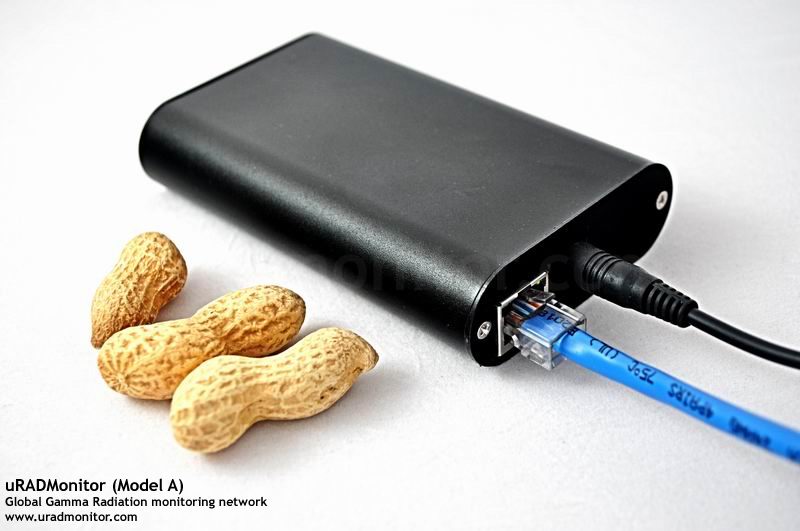
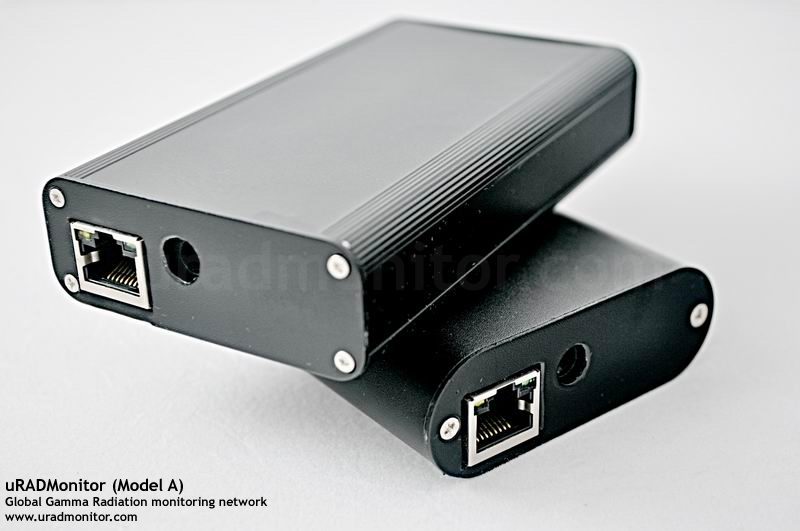
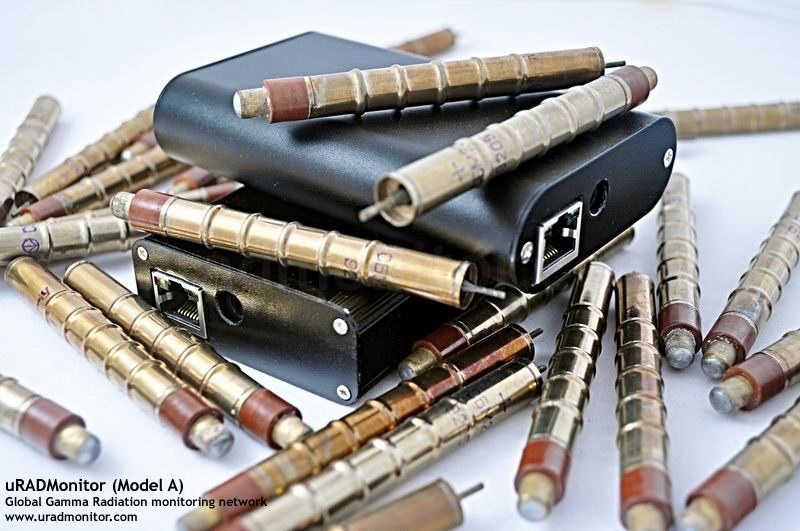
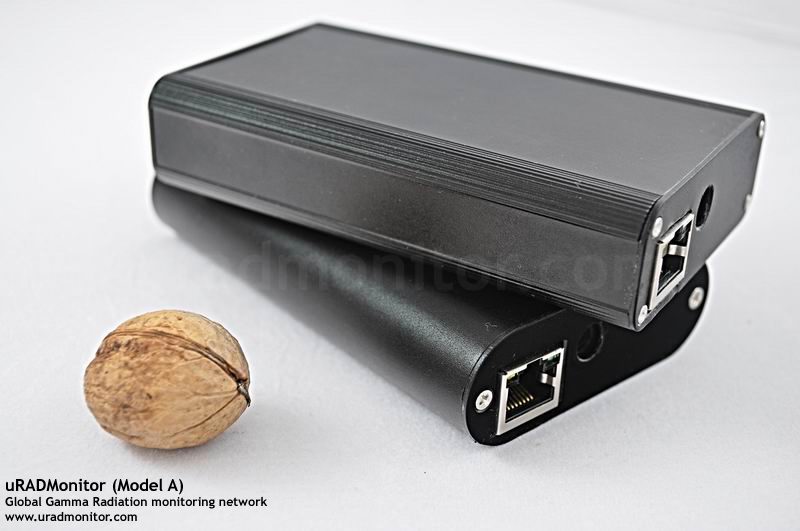
The photos show the compact size, and the few external objects have been added for comparison purposes. Of course, the peanuts are not needed when monitoring the radiation levels.
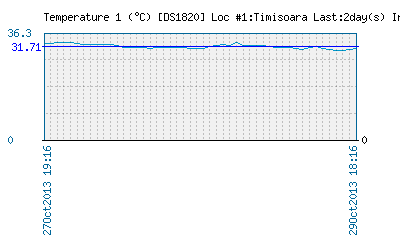
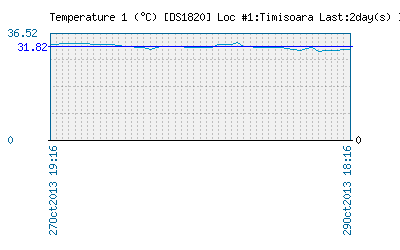
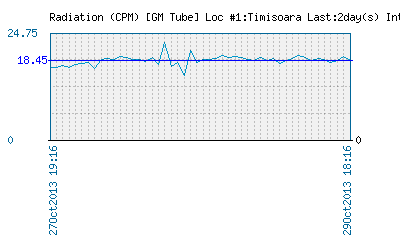
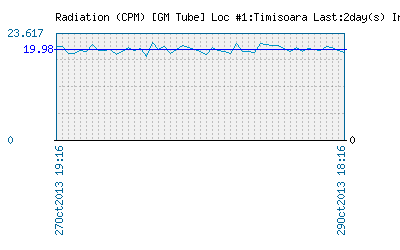
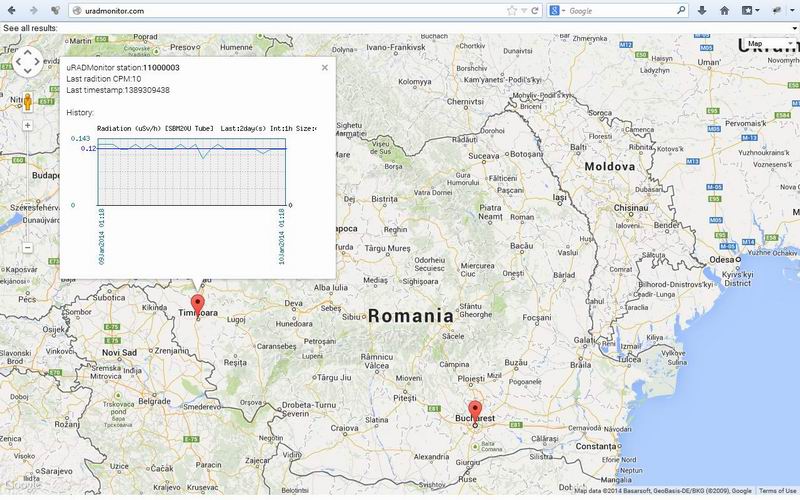
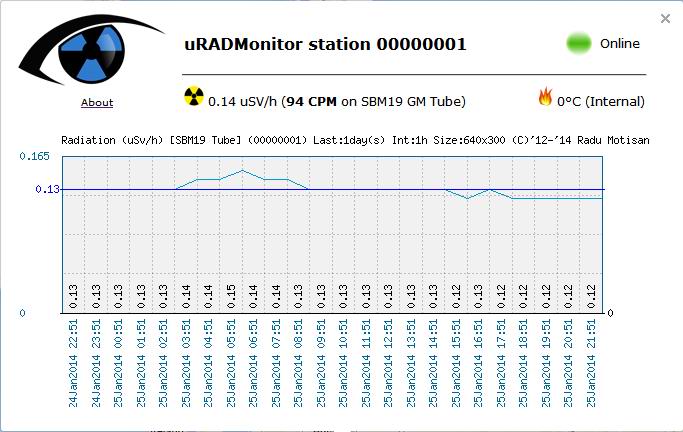
October 10, 2013: Data sample charts
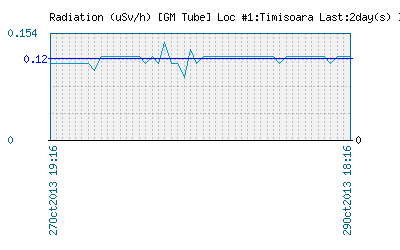
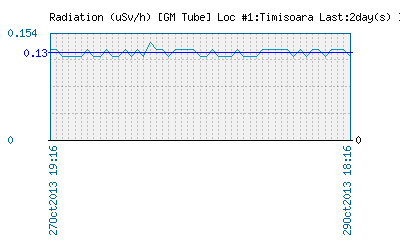
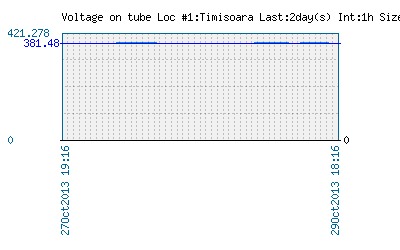
While keeping an eye on the stability of the first two units, I have decided to publish the data, because I’m sure many of you want to see these first tests. But remember, all data show at this point is experimental and for testing purposes only.
The units are currently indoors, and the temperature sensor is inside the case, so the temperature level can be higher.
| Device “#2” (round case): | Device “#3” (rectangular case): |
 |
 |
 |
 |
 |
 |
 |
 |
The dose in uSv/h is approximate. Some people seem to react exaggeratedly to this conversion, resulting in this note (like what other measurement is anything but yet another approximation).
As you can see the Geiger tube voltage has been set to 390V , the inverter’s frequency is set to 17KHz and the duty cycle goes around 41% (but changes automatically to maintain the voltage constant).
EDIT: The test closed on October 29, 2013. The data charts above are showing the last data recorded. You can download the complete database data of this test, here
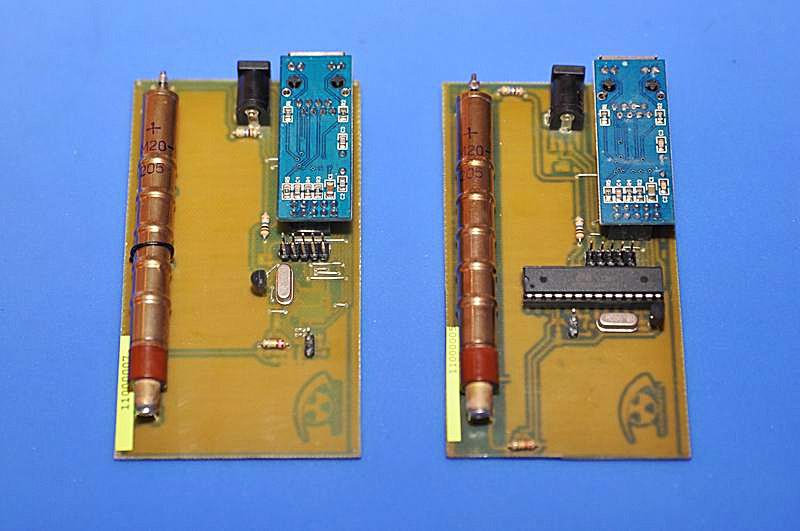
October 13, 2013: Comparing the first two units
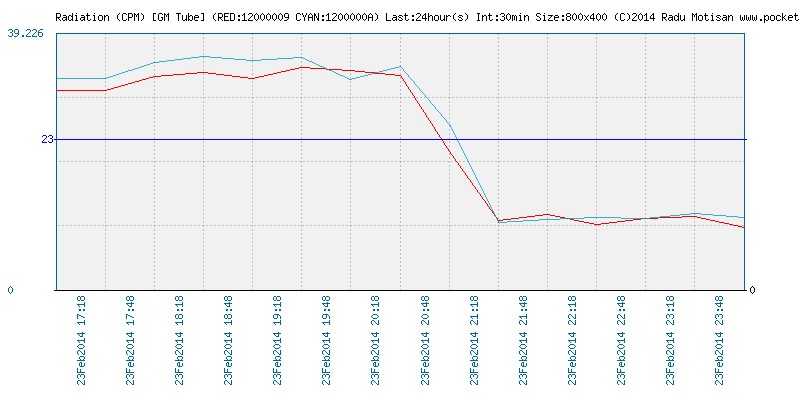
Today for my 13th update to this project, the plan is to add a comparison graph between the data measured with the two prototype devices, #2 and #3.
Looking over the numbers recorded so far, I quickly observed that while there is a negligible difference in CPM levels (probably due to small differences between the two SBM-20 tubes used), both radiation graphs for #2 and #3 follow the same trends.
It seems that even small changes in the radiation field at my location are being picked up in the same way by the two detectors, which is great news given the small values involved (only the background levels).
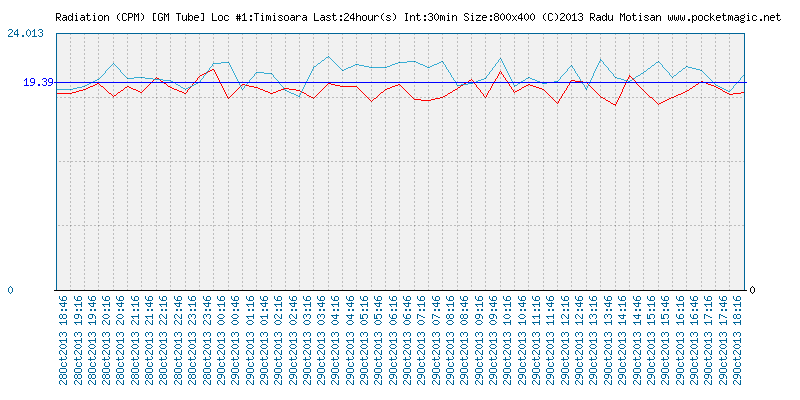
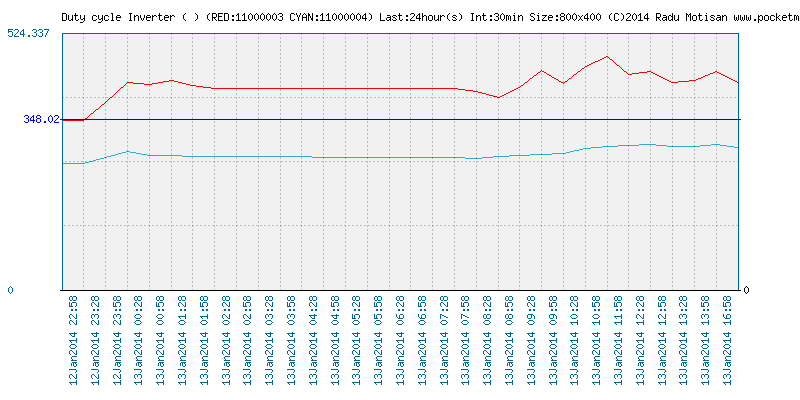
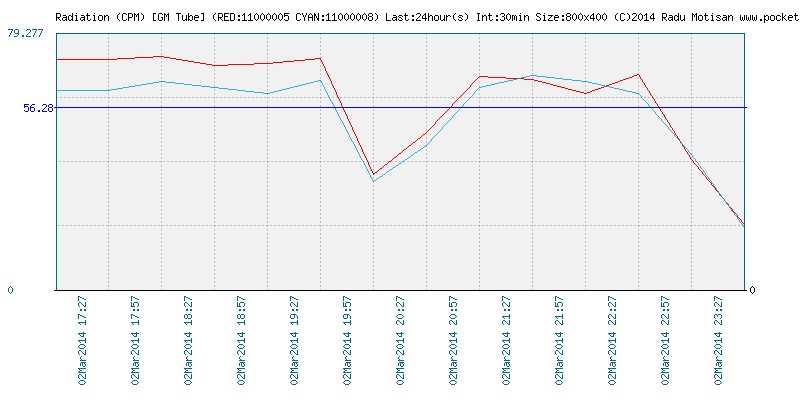
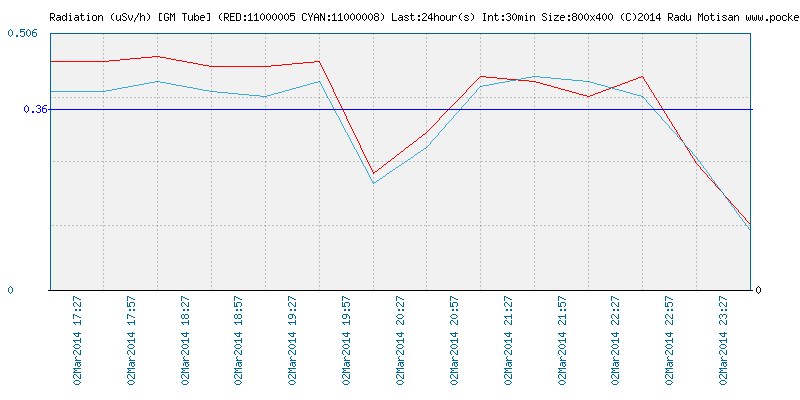
To make viewing data easier, here is a comparison chart for #2 and #3, showing the last 24hours data, integrated at 30 minutes (better resolution than the previous charts):
I plan to run an experiment soon, in which I a radiation source will be positioned equidistant above the two detectors to see the results. Then, another experiment will only have the source on top of one of the two detectors.
EDIT: The test closed on October 29, 2013. The data charts above are showing the last data recorded. You can download the complete database data of this test, here
November 22, 2013: SI-29BG Geiger tubes
I’ve received a new batch of Geiger tubes, this time I opted for the SI-29BG, surprisingly smaller than the SBM-20U, but with great sensitivity.
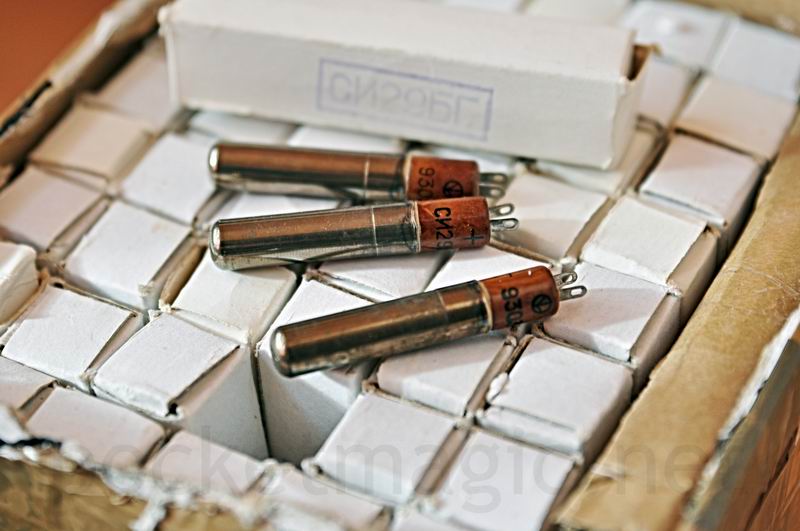
A comparison test between the two can be seen here.
November 26, 2013: Model A with SI-29BG
After receiving the batch of SI-29BG tubes, I had to design a compatible PCB board – a variation of the Model A board for the SBM-20 (presented in the previous posts):
Despite using different tubes, the Model A software compensates the readings and we get consistent indications. A SI-29BG based device is already running in Carei, Romania, and real time data can be seen here.
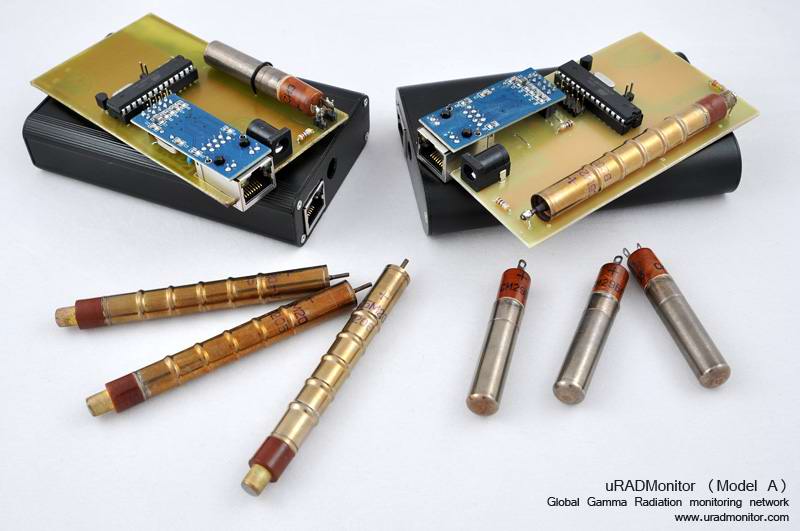
Having completed a few more devices, I had some time for a few pics. See them below, devices with both the SBM-20U and the SI-29BG tubes:
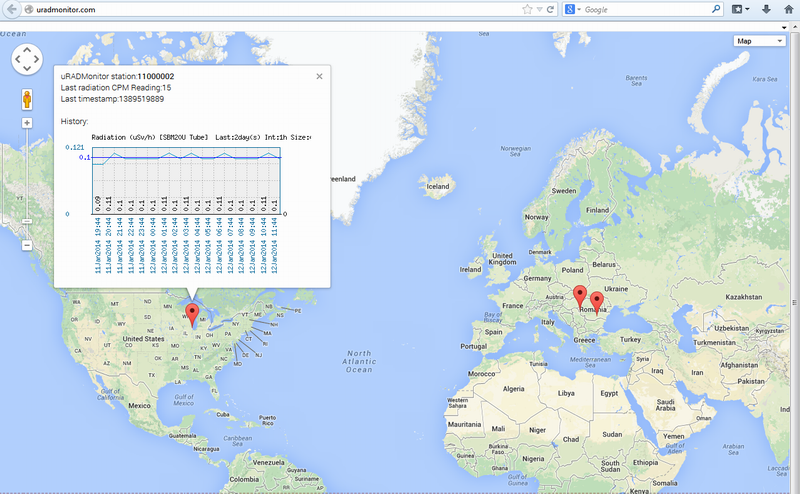
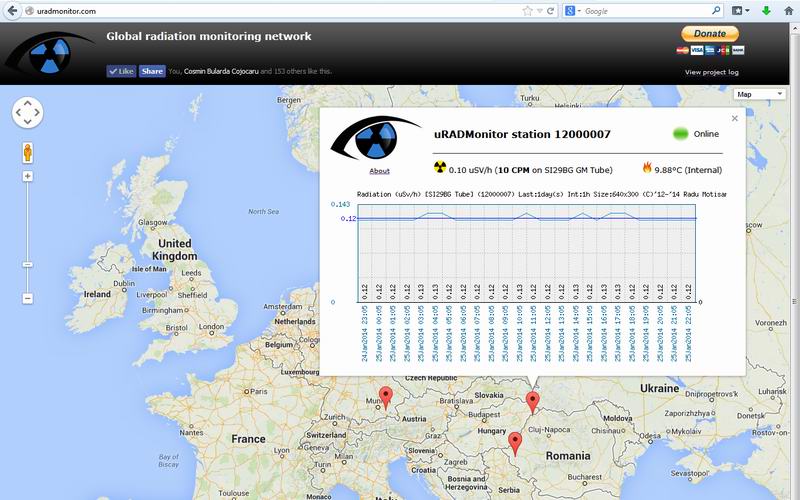
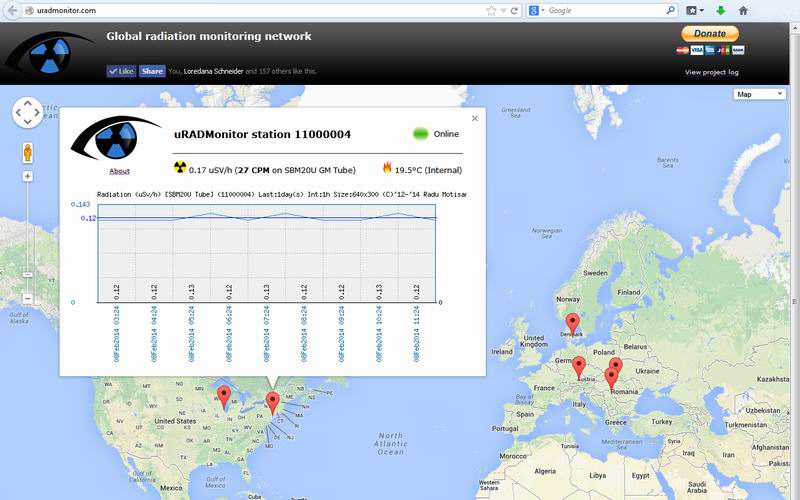
January 09, 2014: Google maps integration
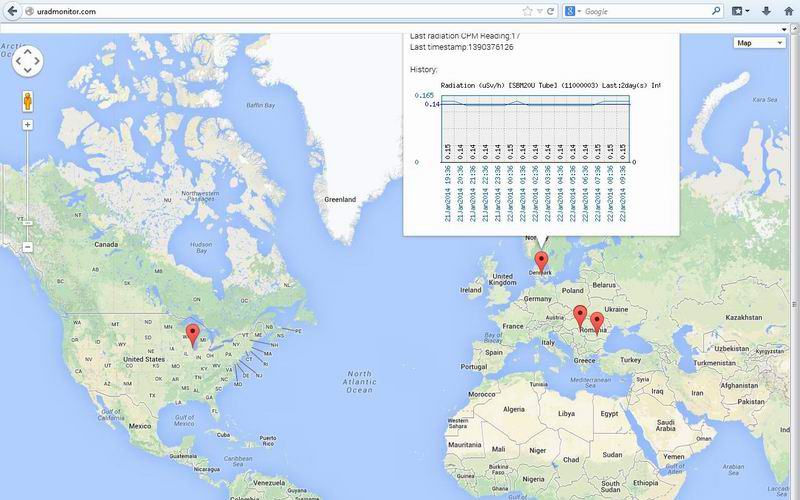
As the first few prototype units were already up and running, pushing streams of data to my server, I was able to make the next step and implement a very basic radiation map plotted upon a Google maps layer. This is just a very basic first integration, as I plan to change the radiation web portal in the months to come:
From now on, anyone can access the real time radiation data on www.uradmonitor.com .
January 11, 2014: First unit overseas
First uRADMonitor in the USA has become operational today in Chicago, IL. You can see the measurements on the radiation data portal.
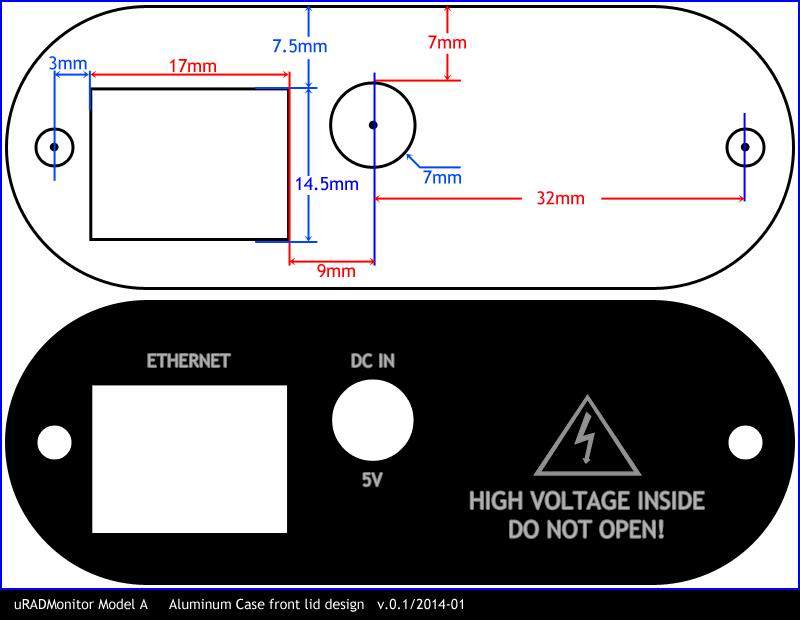
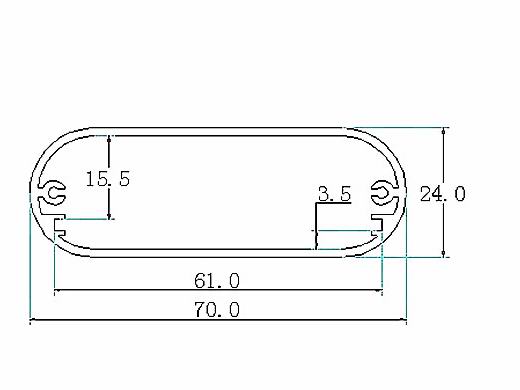
January 12, 2014: Model A Case design
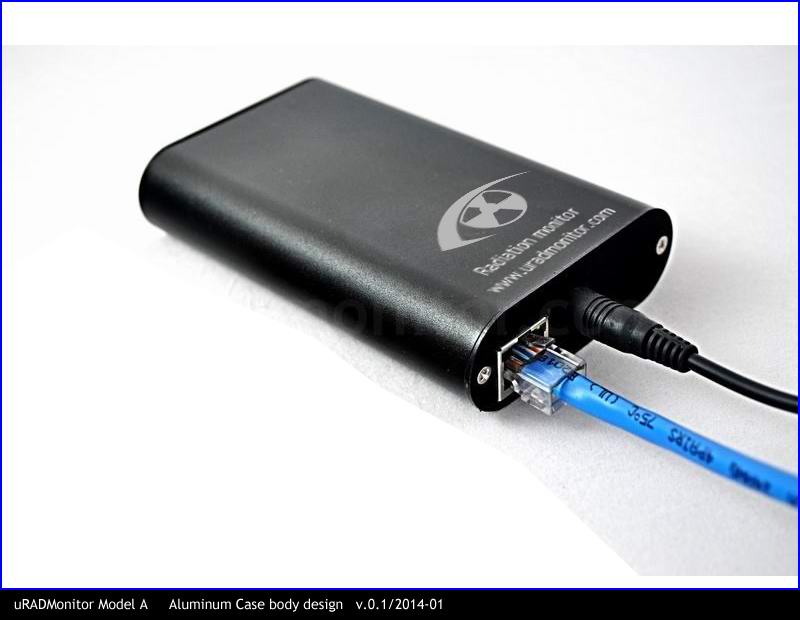
At this point I have to outsource some of the effort needed for building these units. First is the aluminum case, I found a promising Chinese manufacturer that should build the cases according to these specs:
![]()
The front lid offers minimal hints for the two connectors, and the high voltage warning (as you know, the Geiger counter uses a 400V DC supply, not dangerous due to its low energy, but can give quite an unpleasant shock). The body shows the logo and the uradmonitor portal address.
January 13, 2014: Parallel measurements
The plan for global coverage imposes strict demands on the calibration and tolerance of each of the uRADMonitor devices. First thing is to make sure that any two devices, exposed to the same radiation field, will return similar readings.
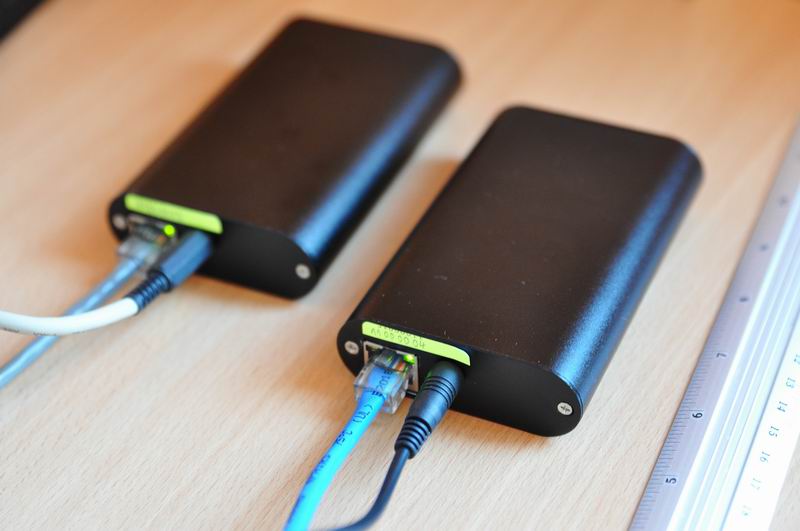
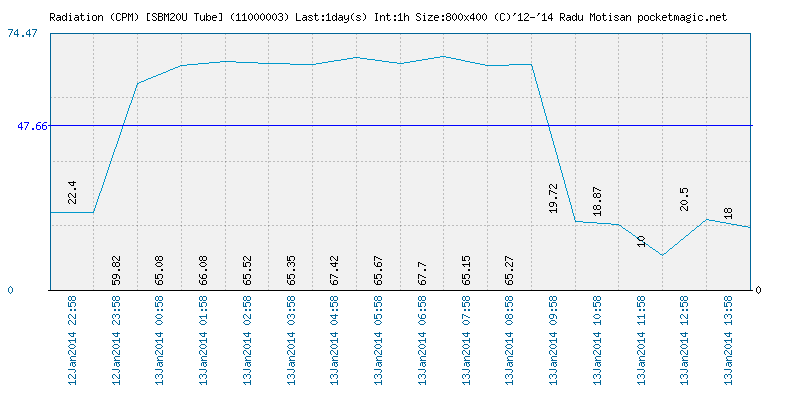
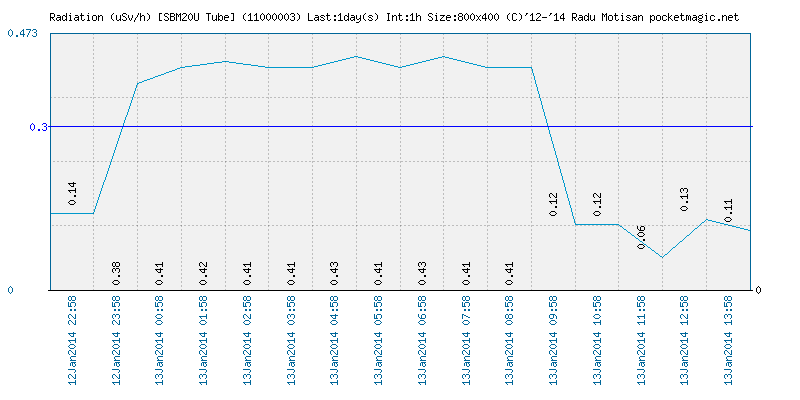
As I was preparing to ship out two additional units #11000003 and #11000004, one to Denmark and one to USA, I had to run a quick test to make sure the two units are properly calibrated. So my plan was to verify the readings for two scenarios: (1) exposure to a radioactive check source and (2) natural background exposure. For both, commercial dosimeters were set in place as a reference. One was the Terra-P MKS-05 and the second the Radex 1706.
(1) For the first scenario, the two uRADMonitor units were placed side by side. A small natural mineral sample containing thorium (thorite) was placed symmetrical to the position of the detecting element (SBM-20U) inside the two units. The Terra-P and the Radex-1706 were also used as a reference in exactly the same setup, placing them at the same distance (measured from the cvasi-point-like thorite mineral to their Geiger tube detector element, inside the case):
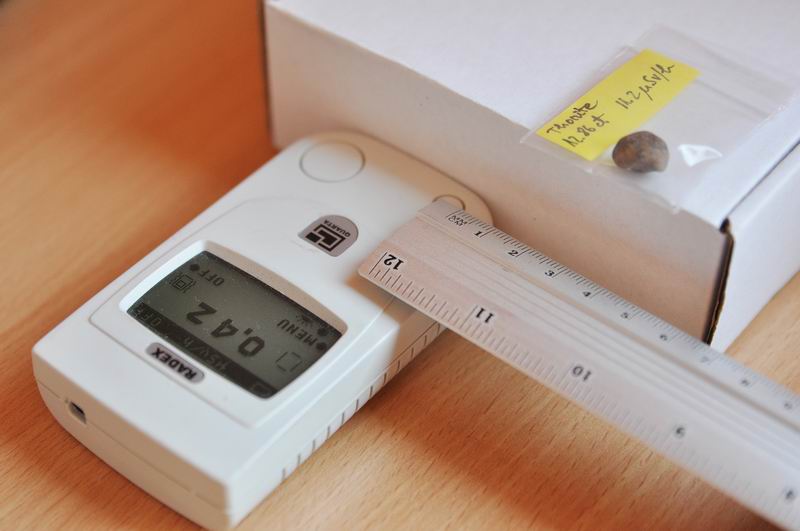
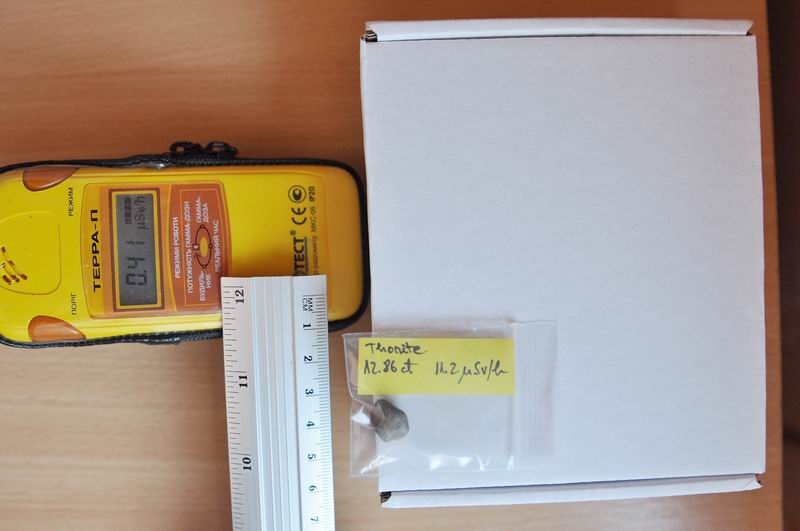
The two uRADMonitor units were left like described for an interval of aprox. 9 hours. The collected data is available below. Both the Terra-P and the Radex agree on a measurement value of aprox. 40uSv/h.
(2) For the second scenario, the two uRADMonitor units were placed alongside for yet another interval of aprox. 5 hours, but this time they were exposed to only the background radiation as the Thorite sample has been removed from the setup.
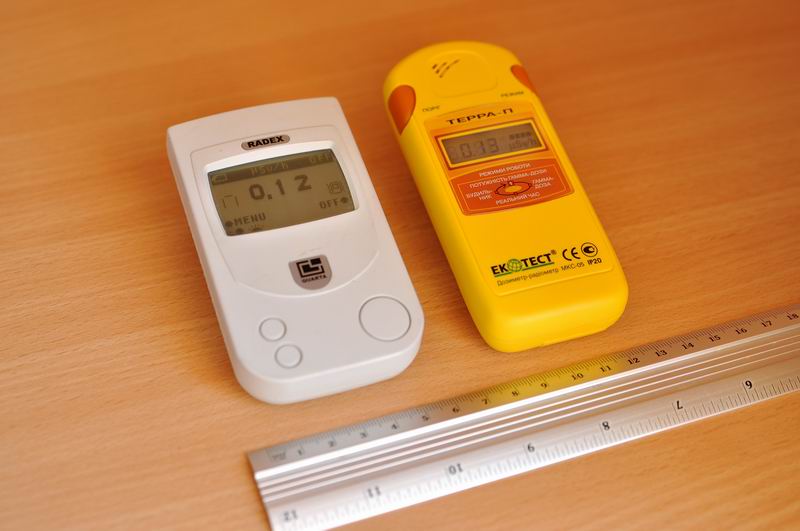
The Terra-P and the Radex show a result close to 0.12uSV/h for the normal background radiation level.
The results:
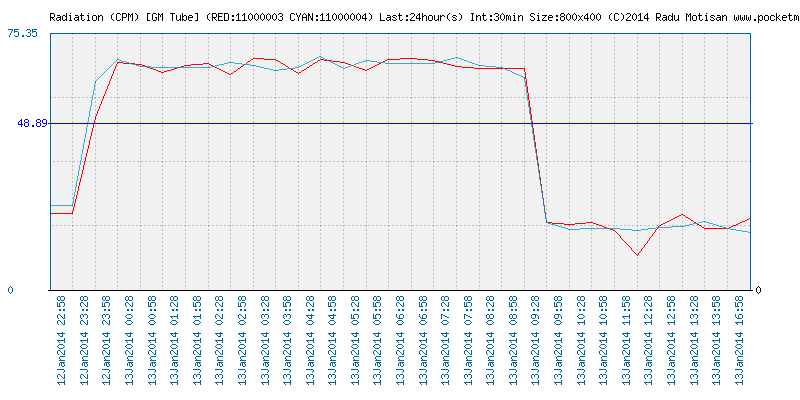
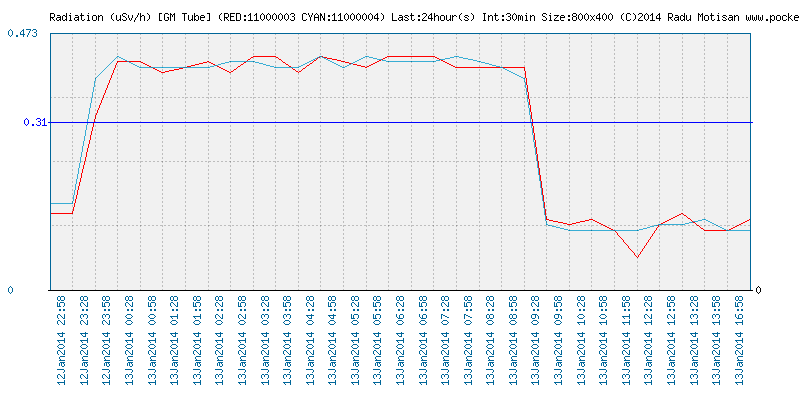
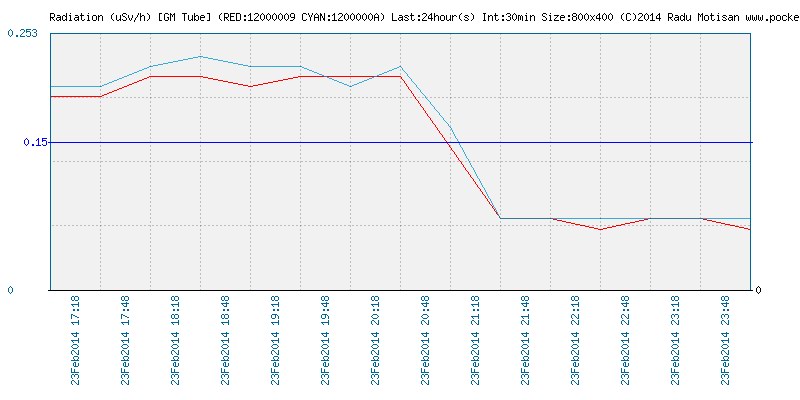
The data collected by the two uRADMonitor units can be seen in the charts below, both in CPM and the equivalent dose (uSV/h) estimation, click for larger images:
  |
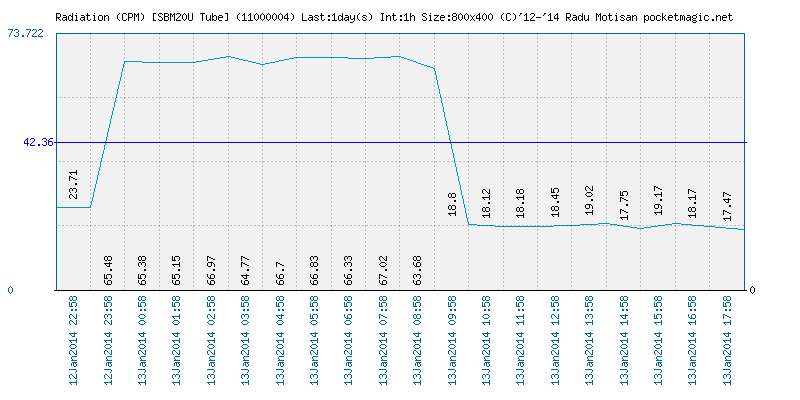 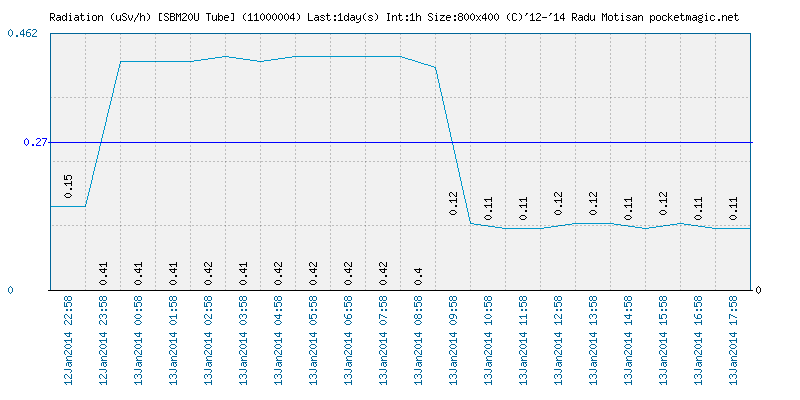 |
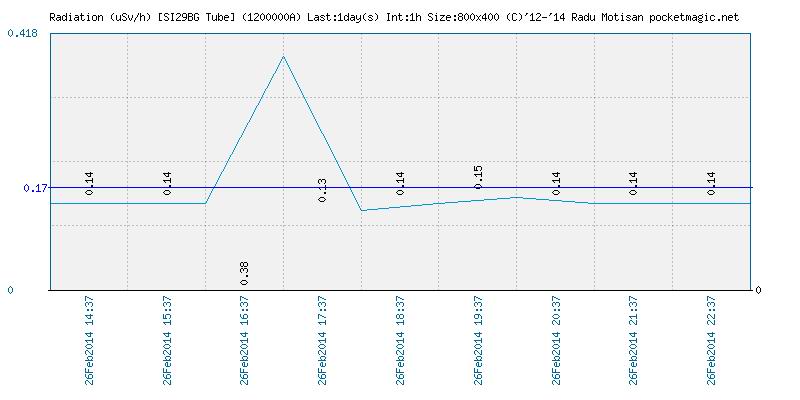
Note: The blue line is just the average value of all the values in the graph. It is not a coordinate on the vertical axis. The exact values plotted can be seen in the individual charts, where the horizontal axis is the time, and the measured values are printed directly on the graph line in black.
The higher values correspond to the exposure to the radiation emitted from the Torrite sample, exactly as shown in the previous pictures. Both uRADMonitor units have registered consistent values, 0.40uSV/h for the Thorite sample, and 0.12uSV/h for the background radiation (in the right side of the graphs, where the check source was removed). Here is a comparison chart, to offer a better view on these numbers:
And the linear aproximation to equivalent dose in uSv/h:
As pictured we got a very good consistency in the way the two devices registered the radiation they were exposed to. Also the equivalent dose estimates are matching those of the two commercial units.
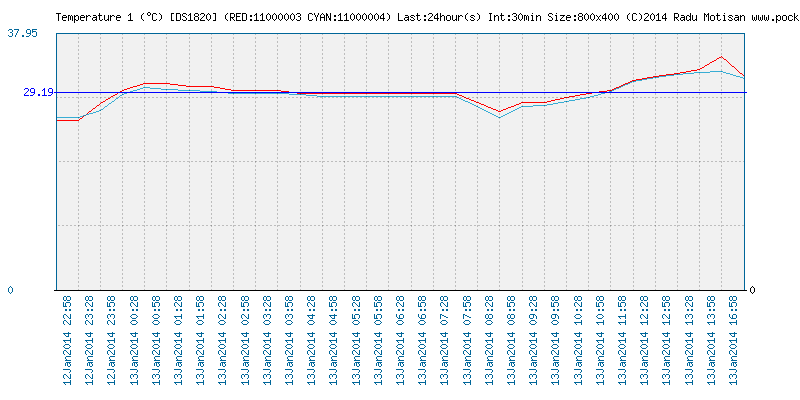
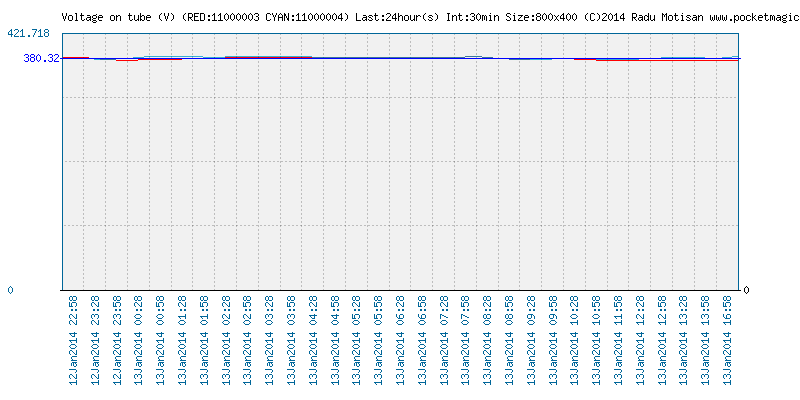
Here are the other parameters monitored by the two uRADMonitor stations, also in good concordance:
As this test was successful, yet another uRADMonitor device was shipped to Denmark, hoping to see it up and running the next few days, as it gets to its destination.
January 22, 2014: New units in Denmark and Germany
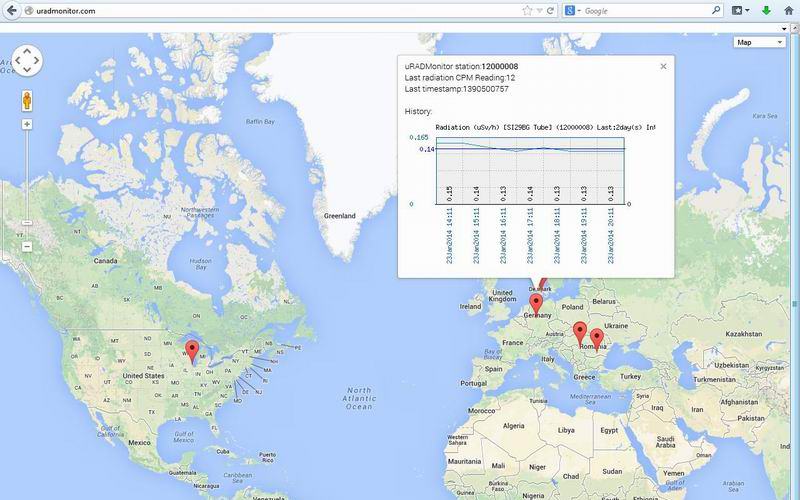
Two more units got online today, one in Denmark (#11000003) and another one in Germany (#12000008). See the real time data on the uRADMonitor portal.
January 24, 2014: New model A PCB Design
It’s been a busy day today, but I got a new PCB design for the model A. This will be used to derive the model B, as this latest revision shrinks everything even further, making space for additional components.
To name a few changes, the microcontroller was changed from DIP to SMD, the high voltage inverter has been reorganized (in terms of space), and the preamplifier also got a new location. The board is designed to fit any of the two tubes, SBM-20 or SI29BG.
The last picture shows a comparison with the PCB featuring the DIP microcontroller. Despite the ultra small components and traces, this latest device worked from the first test.
January 25, 2014: uRADMonitor portal updates
The previous version of the uRADMonitor portal barely presented the radiation data. It was very basic, and not quite user friendly. I now tried to change that a little, but there is still a lot of work to do. Here’s what was changed:
– the station detailed info screen was improved, to show a few more details, all better structured:
The most important change was the Online / Offline status. If is computed by comparing the last data package received to the current time. Considering the data reports are sent one per every minute, if the last entry is 5 minutes old, we consider the station offline. This process is automated. When the station restarts its broadcast, it will change status to Online.
– The last entries as shown at the top, the last readings for radiation (both the equivalent dose and the counts per minute for the particular Geiger tube) and for the internal temperature (these units have an internal temperature sensor).
– Finally the history chart is now bigger, and shows data for the last 24 hours as recorded.
As the model A units are located using the IP , errors in localization are normal. For most cases we got enough accuracy to correctly pinpoint the city where the station is broadcasting from. But there are situations where manual corrections are required. Sometimes we also want to protect the privacy of the owner of the uRADMonitor station. This is why I added a manual location override option. Using it, I was able to correct the location for #12000007 to Carei, Romania (Instead of Bucharest) and #12000008 to Schecen.
Now there’s also a Donate button. Those who feel that this project has potential to be useful to the community, are welcome to support it. I have started it with very little resources, but I am committed to make it grow to the global scale.
February 08, 2014: A new radiation monitor, in New York, USA
The news for today include two things. First, I finally found the perfect case for the Model A. It is a high quality aluminum case, that comes with a nice wall mount. It’s a little smaller in width than what I’ve previously used, but I was able to make a new PCB to adapt the circuit to the new size. Before I can get enough of these, the previous black case will still be used for the model A.
For the model B, I will use the larger black (round) case, as I need to add a LCD, a battery and some additional internal modules, so the extra space is important.
I said there were two updates for today. Well the news is that the second uRADMonitor running on American soil is up and running at a location close to New York:
The radiation monitors can be seen on the map at: http://www.uradmonitor.com
February 16, 2014: Model A wall mount case
Finally the case with wall mount support and the new PCB are ready, and here is the second Model A variant:
February 26, 2014: New unit in Arad, Romania
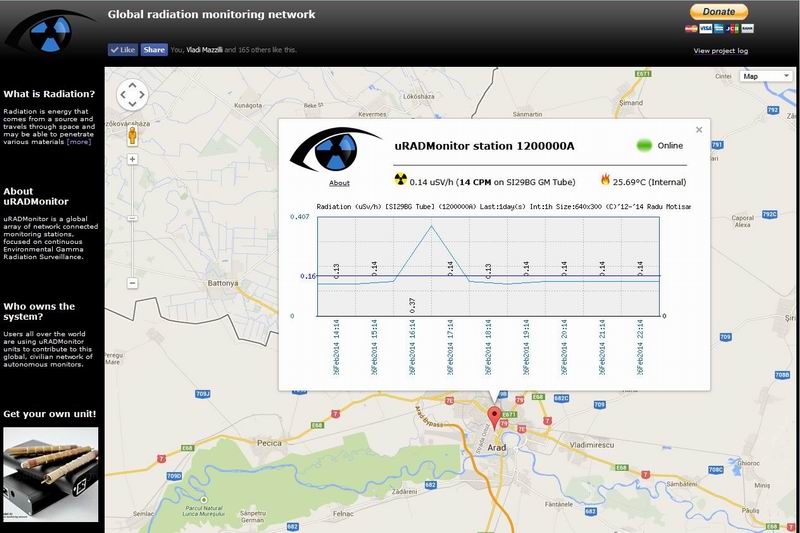
Unit 120000A has become operational today, in Arad, Romania. The unit appeared on the map as soon as it was plugged in, with a very good geographic accuracy thanks to the built in IP locator. Nevertheless the coordinates have been manually adjusted, for even better accuracy, closer to the real position.
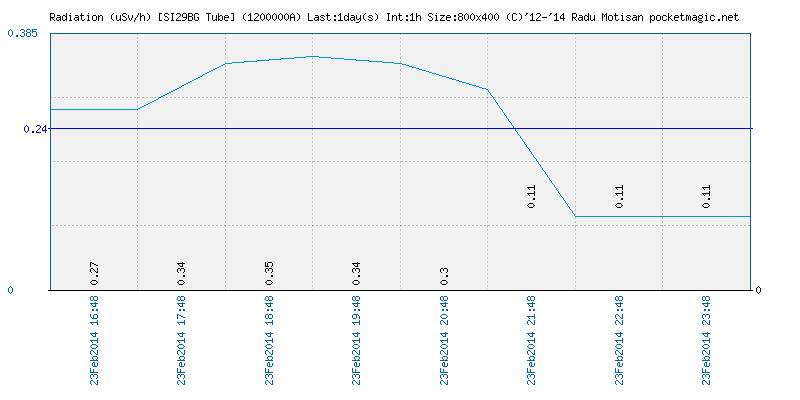
Before sending this unit out, it has been calibrated and verified against another unit. The two units ran in parallel for several hours, covering two tests: exposure to a radioactive source (a natural Thorite crystal placed at given/symmetric distance to the two detectors), and another test consisting of exposure to the natural background radiation. Here are the registered measurements:
Radiation levels:
Temperature and voltage on the two tubes:
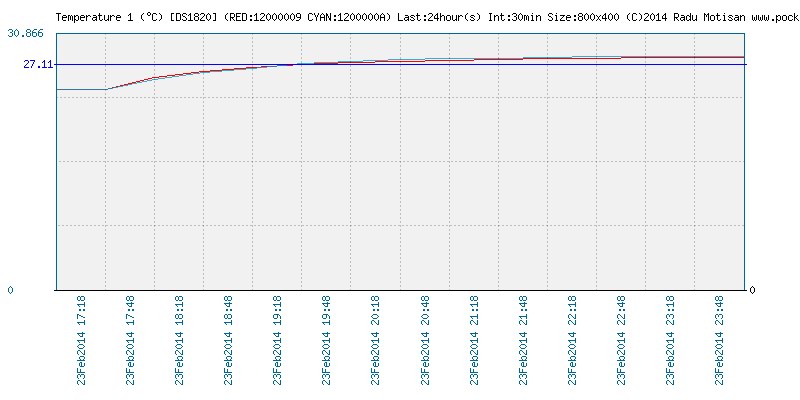
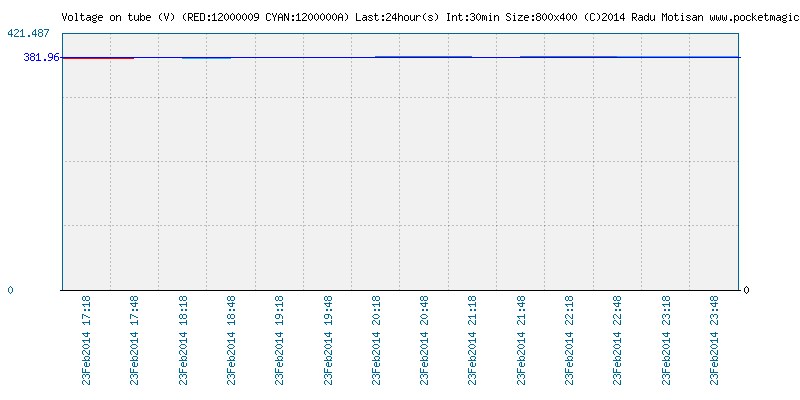
The two devices have registered the radiation levels in a consistent manner so the tests were successful. The background radiation level at my location in Timisoara, Romania where the tests were performed, was measured by the two devices to an approximative (attribute used because of the CPM->uSV/h conversion) value of 0.11uSv/h:
As the unit arrived at its destination, in Arad, Romania, I was surprised to see the live data shows a perceptible increase in radiation levels:
I am not sure what caused the spike in the chart, but the rest of the picture clearly shows an average value of 0.14uSv/h, and that’s something, considering Arad is not more than 50km from Timisoara. Here is the station up and running on the uRadmonitor.com portal:
And here are a few pics showing the 1200000A running in parallel with the expensive Gamma Scout dosimeter. The results measured by the 1200000A , currently at 0.14uSv/h, are in good concordance to the values displayed by the Gamma Scout:
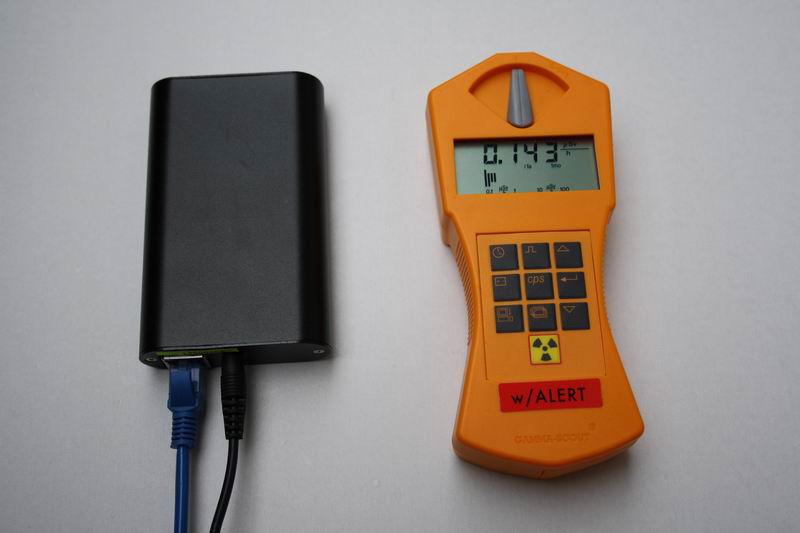
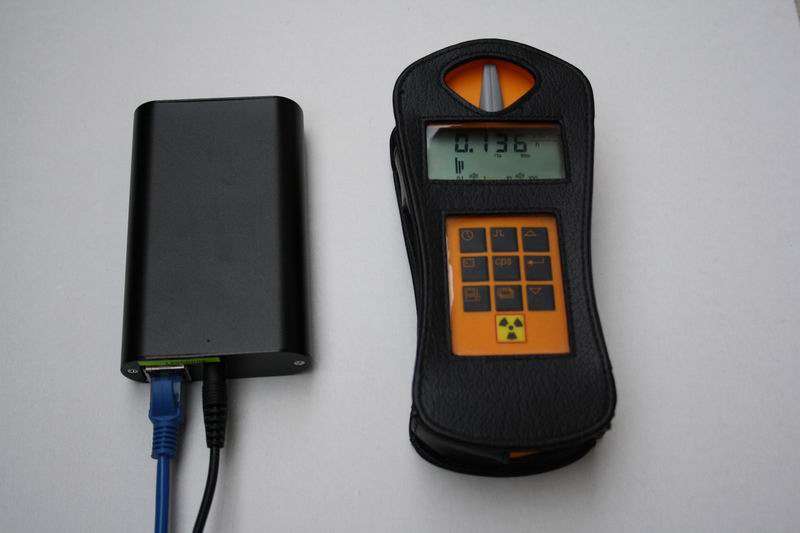
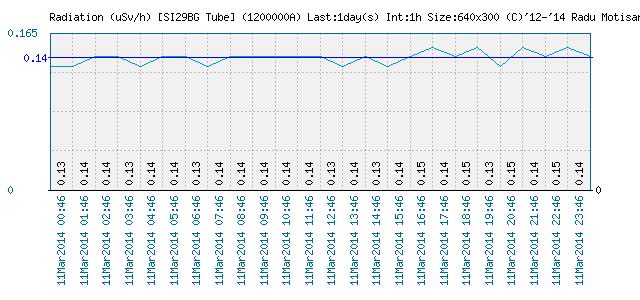
This uRADMonitor unit has been calibrated at a different location, where it showed only 0.12uSV/h, yet at the place of destination it was able to measure the radiation correctly , and in good concordance with the Gamma Scout dosimeter.
March 10, 2014: New unit in Augsburg, Germany
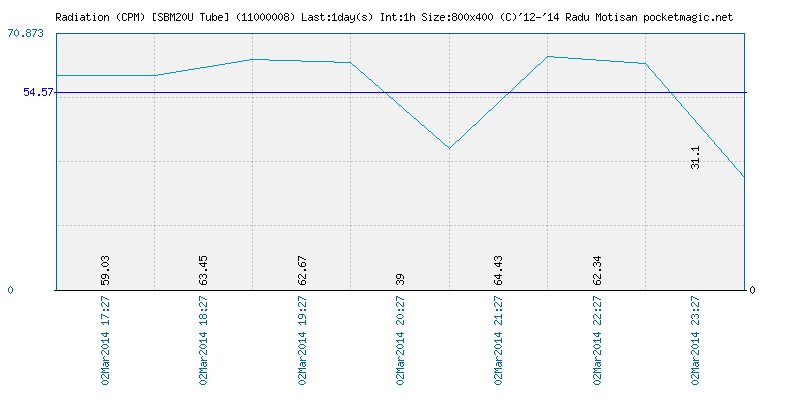
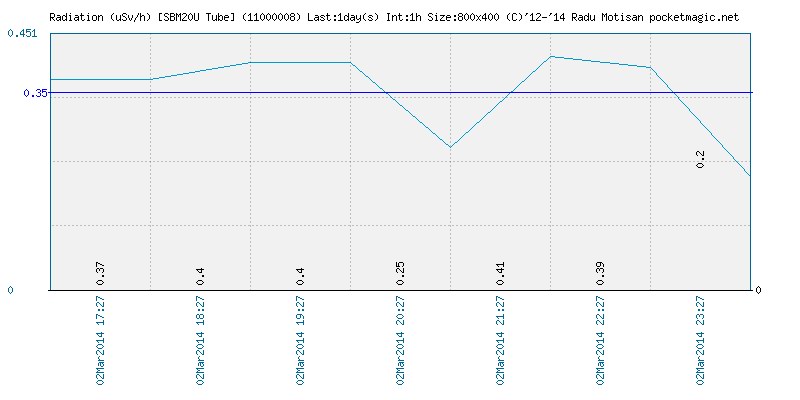
The second unit running on German soil has become operational today, in Augsburg, Germany.
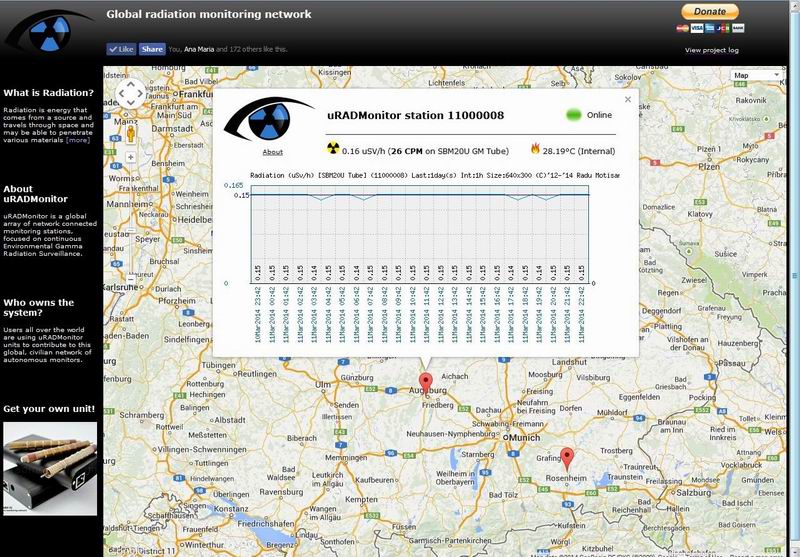
It measures an average of 0.15uSv/h, relatively higher then the other units currently in the network. Before sending it out, the calibration tests performed on the 11000008 in Timisoara gave results closer to the 0.12uSv/h figure, considerably smaller:
Also the Augsburg natural radiation background level seems to be higher than the one measured at only 100km to the South-East in Schechen, Germany, by the uRADMonitor station 12000008:
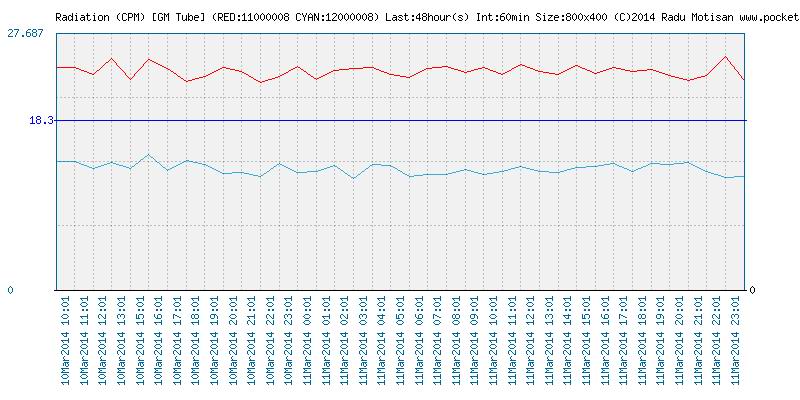
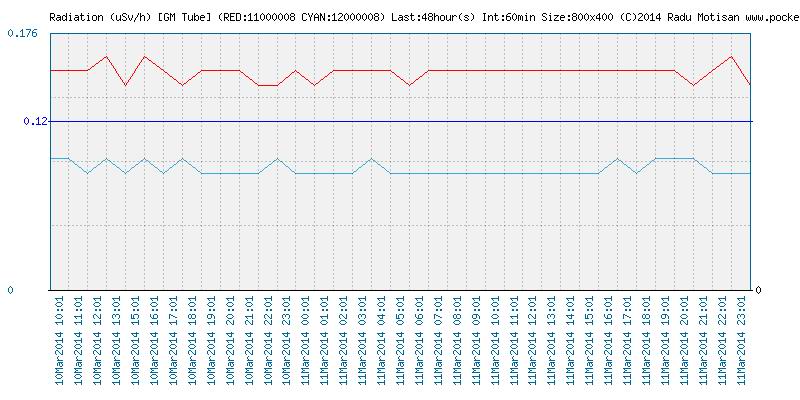
The 11000008 in Augsburg averages 0.15uSv/h for the last 24 hours, while the 1200008 in Schechen only reaches 0.13uSv/h . The real time data is available here.
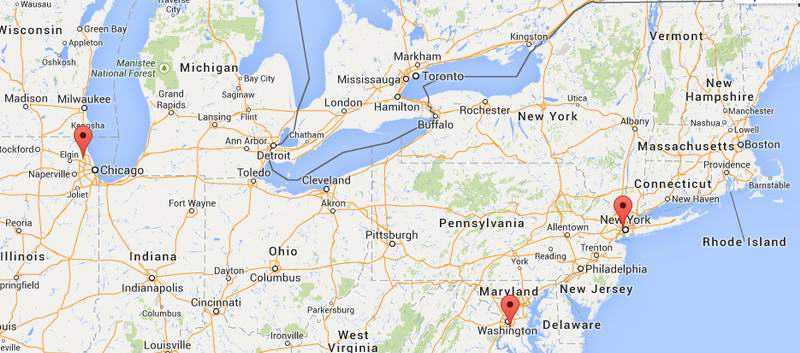
March 20, 2014: New unit in Washington, USA
Unit #11000006 went online today, in Washington, USA.
EDIT: there is a dedicated blog on this project, here. Make sure to follow it for latest news.

Hi,
I don’t know if you take on feature ideas, but here is my thought: Could you make it an option to use another GM-tube by adding a switched plug to the housing? The idea is that if an external tube is plugged in, the internal tube is switched off. This way you could use external GM-tubes (like the more sensitive large SBM-19 (that you also used for your urad project) for the function as fixed monitoring station, while being able to use the internal tube for mobile purposes as dosimeter. The icing on the cake would be if you could select the tube you use (lets say for the 5-10 most popular and available 400V-tubes) in the software menu for instant proper conversion rates.
Another question: Why do you want to use an aluminum housing with an internal tube (instead of e.g. ABS-Plastic)? Wouldn’t that lower beta-sensitivity quite a bit? Or do you want to supress beta counts on purpose?
And a last one: If the cost is not prohibitive, a wi-fi option would be great (no ethernat cables to the monitoring station ouside your home and the router inside neccessary).
I’m looking forward to see this on Kickstarter!
Greetings
Herbert
Hi Herbert, Of course I do! I can’t promise I would be able to change the design and fit in a wlan card, but that would certainly be a nice feature to have. Also the other suggestions.
I opted for aluminum casing and gamma only, for practical reasons (aluminum casing is what I have at hand via some chinese manufacturers, the beta sources are not so frequent to prove an utility for monitoring purposes). Do you think this should be different?
The optional connector is an option should the circuit be modified to handle anode tube connection. But I am planning on using a SBM-20 tube, not as sensitive as the SBM-19, but still an excellent choice for the purpose.
Unless the unit is mounted outside, the resulting dose rate readings will not be useful. Who needs to know the doserate inside someones house? better would be a waterproof wifi unit that you screw to the wall of your house outside and it measures the proper external doserate.
Houses shield the doserate by a considerable amount, especially Iodine & colbalt57 and other low energy isotopes emmited during an accident. Unless you introduce a mounting standard and calibration the results will not be comparable with each other, and you run the risk of giving out misinformation on the true doserate.
Good luck with the project though, I just think it’s something you need to consider if your making it a global system.
Mark
Hi,
thanks for replying so quickly. I think the SBM-20 would certainly be a good choice. The idea with the plug for an external tube is that this way the device would gain more flexibility – it all depends on the customers you intend to reach: Most potential users would happily go with the out-of-the-box solution, but in the nature of this project also a lot of hobbyists (me for example) would be interested that want some flexibiliy such as it being open source, probably provide some easy to connect interface to their own (arduino) projects (e.g. to add NOx or CO2-Sensors, wind speed meters, whatever), or the possibility to use tubes they already own.
In terms of wi-fi, have you had a look at this KS-project:
http://www.kickstarter.com/projects/sparkdevices/spark-core-wi-fi-for-everything-arduino-compatible?ref=search
they claim “50mA typical current consumption” (up to 300mA while transmitting), but it wouldn’t have to listen to receive data all the time, so most of the time it could be switched off, only turning itself on once in a while for some seconds to transmit stored data (or on demand, pushing a button).
I’m not sure if power would be a real problem with wi-fi, because as a fixed monitoring station it will most likely not run on batteries only, and for mobile use you could make it optional (switch wifi off and only use it to transmit data back home to your computer / the urad server).
Considering the housing: I always prefer functionality over style for measuring instruments – I guess ABS-cases could also be made fairly cheap (and with the right color / finish be stylish), can be weather sealed and would not obstruct the radiation you want to measure (this depends on the purpose: for background gamma only would be ok, but for mobile use beta-sensitivity could be interesting if you have a dedicated radiation source you want to measure).
But it is not that I would oppose your choice of housing – you have far more practical experience in this than I have, so I would definitely trust your decision on this one.
Considering what Mark wrote: I think it was always meant to be a somewhat weatherproof monitor outside the house (e.g. installed on a balcony or mounted to an outside wall of the house). But he is right that the devices have to be calibrated and be mounted in rather similar settings, so the readings are comparable. But this is the problem of every citizen data network. In Japan the safecast network issued a selfmade geigercounter (bgeigi) to volunteers and told them how to conduct a standard instrument reading so they could get comperable readings all over japan. Other citizen radiation networks make it possible to name the device that was used, so for statistical purposes you can at least identify the different data sources and factor a correction value to compare the readings. But data quality on a scientific level is hard to achieve for a project like this. This has always been an issue, as “radiation” is not an easy thing to measure reliably, let alone interpret it in detail.
Best practical case is that you can see relibale changes in what your device measures (“hm, the background levels doubled every day in the last three days – there is something going on”).
Hi Mark,
All readings can prove useful, including indoors, as these would be mapped on a global map layer, anyone can choose their area of interest; but to answer the question, this unit is intended for both indoor and outdoor use. The initial plan was have it as an exclusive monitor/no LCD/no fancy features, then this changed to having two separate units (monitor+mobile), then I finally decided to try combining the two, as many users would be interested in taking the monitor off the wall for various measurements or for different places – this is why I consider mobility a good addon to the features list. For mounting outside, I can design it to either cover the LCD with a transparent waterproof layer or use some kind of plastic waterproof shield put over the entire unit (like a plastic bag). Suggestions are welcome here. Also for outside use, an easy to use wall-fixing method would be provided.
@Herbert : my mistake about the WLAN consumption: we actually don’t care much about it, as when connected to WLAN it would probably just work as a monitor, with the DC supply connected overruling the batteries. So the consumption is not an issue here. The Spark Core looks awesome. I will think more on this – as I already told you – I would love to have WLAN capabilities myself!
I can’t say I decided on the final casing manufacturer. If it was to make it as I like, I would come up with some interesting features – I’m not sure how far I can go in terms of customization options with the manufacturers. So I just imagined the very basic: a robust case with a few windows for the connectors, sdcard and lcd. ABS-cases might be another option, but I need to find a manufacturer willing to do what I need first . So I’ll be taking this into account as well.
As for the target users, we both know that highly advanced features will go unnoticed by most of the end users – that the most used feature will come to the “LOW/NORMAL/HIGH/DANGER” alert, let alone the conversions in dose equivalent or the absorbed dose – with all their complications. This is why I try to combine the two important things: make it a great tool, but make it appealing to most of the users while keeping the design process in reasonable limits. If I fail getting the right balance, I might fail to get the project funded . Sorry to conclude that commercial features are a must for a product of this nature as well. And this brings me back to the casing : aluminum might sell better 🙁
Nevertheless I’d love to make this configurable. I myself also enjoy hacking and moding various devices, this is how cool things get done, but this also makes cool things even cooler. To offer external tube support, I can go as simple as providing an audio connector on a side, that when plugged in would disconnect the internal tube as you suggested. I did this for one of my other digital counter, in a newer version (http://www.pocketmagic.net/2012/12/diyhomemade-portable-radiation-dosimeter/)
So as you can see, we share a similar vision on this. The only catch is that getting it to the real world comes with several obstacles, not necessarily difficult but I just need to learn more on them, as it is my first project of this kind.
@Herbert #2, indeed, transforming the radiation readings from CPM’s to dose equivalent is not exactly a correct mathematical approach. And this is because radiation can have different energy, and the Geiger tube is unable to make energy related measurements, while the differences in energy levels can have a huge impact on the real dose equivalent value.
Last year when I built my first uRADMonitor station, I got some nice feedback from dr. Nicolae Victor Zamfir, director of the Horia Hulubei National Institute of Physics and Nuclear Engineering, pointing out that any attempt of guessing uSV/h readings out of CPM would be “an approximation” in the best case. Read it if you like here: http://www.pocketmagic.net/2012/10/uradmonitor-online-remote-radiation-monitoring-station/#comment-4992 , using an automated translator.
Regarding waterproofing the device, my first device’s home-made PVC plastic case holds well despite the last year’s winter , the many rains and other natural phenomenons (see http://www.pocketmagic.net/wp-content/uploads/2012/10/uradmonitor_snow.jpg ). I intend to make the KS project even better , and with a polished/commercial look.
I am not sure I understand what you guys mean by having “comparable readings” .
Hi Radu,
the audio port would be interesting as an interface, but this would mean that you have to use a separate 400V-driver / logic for the external tube, that provides an audio-port. Having a (simple) plug for an external tube directly in the device (delivering 400V), switching the interal tube off when used, would allow to connect another (400V) tube directly – just a thought. But if this is implemented or not, the device will be very interesting anyway.
BTW, in Terms of “thinking Kickstarter” you could calculate the cost of implementing some of the optional features before and offer them as “stretch goals”, implementing them only if a certain level of funding (beyond the initial goal) is reached. This will boost your campaign on the one hand and allow for more features if you get a lot of funding. But better plan and calculate those optional features in advance. I backed 50+ KS projects so far, and stretch goals have always been an important topic in successful campaigns, as they work as incentive to spent more money to reach this feature. I don’t know your experience with Kickstarter, but if you don’t have backed some campaigns yourself, I would recommend that you have a look at some comparable projects (APOC, Safecast X, …). Also look at some less successful projects. It is quite demanding – permanent communication with the backers is key to successful campaigns – also realistic goals and deadlines you stick to. Most often disputes start after the funding, when communication stops and deadlines are not met… better start as prepared as you can be… backers are a tough crowd 😉
Cheers
Herbert
Hi Herbert, sorry for the confusion. By saying I would add an audio connector I didn’t imply it would transmit audio pulses. Instead it would do very much what the external connectors (usually BNC) do for supporting external tubes: provide the full 400V voltage and sense the pulses generated in the tube. In other words it would be connected in parallel over the internal tube, just use the interrupter to break the internal tube connections. So very much like what you imagined. I suggested using an audio connector because it can handle 400V perfectly fine, it is shielded and has the build in switch/circuit breaker that can be used with the internal tube.
Thanks for the excellent KS suggestions – my experience is limited in this area, and besides the technical project details I’m caught into, I also started to invest daily time in reading articles on this topic and checking the way the system works. Indeed some of the topics I have found, are consistent with what you concentrated in your comment. Thanks for your valuable suggestions, I wouldn’t mind if you would keep them coming .
As a quick techie update I have tested the inverter supply against a more active source, to measure the voltage drop if any, and the counter stability at high rates. Great results so far, I will soon update the article above.
Hi,
you wrote “I am not sure I understand what you guys mean by having “comparable readings”.”
It means on a network of different devices, or different ways how they are installed (inside, outside, with a roof above, inside a box, out in the open, near the ground, higher up on a pole, …) a CPM-Reading from one place can not be 1:1 compared to the other. Also, as you have pointed out above, as for different kinds of radiation / energy levels / isotope mixes CPM-Counts (let alone dose equivalents) may vary too in different locations.
The question then is: What purpose does such a network serve, if the readings from the different locations are not (scientificly) comperable and do not tell you the absolute radiation level? As I said above, this is always a problem with data networks that are not strictly under scientific control. The most you can hope for with the uRad-Network is getting some significant interpretation from changes, like “the values of a lot of urad-monitor stations in Romania have doubled in the last 24 hours”. What you cant reliably say is: The background level at place X is Y microSievert – the different settings how the monitoring stations are installed do not provide comparable absolut values – at least not of hard scientific quality.
Hi,
thank you for explaining the idea with the audio port again – now I got it 🙂
If you have questions about Kickstarter I will try to be of help – but keep in mind that I only have the limited experience as a backer, not as a creator. You have my e-mail adress – so just write me if you think I can help, I will gladly share my perspective concerning KS-Projects with you.
Best regards
Herbert
Thanks Herbert,
Regarding the “comparable readings”, your point makes sense.
But .. I’m not sure how relevant it is. Be it placed in various ways outside (closer to -or- far away from the ground), inside (ventilated or not, etc), we’ll get very much the same readings:
– a poorly ventilated cellar shows 0.17uSv/h
– a concrete made storage room shows 0.15uSv/h
– the room I’m living in shows 0.13uSv/h
– a salt mine shows 0.06uSv/h
– the inside of a house made of bricks 0.12uSv/h
– etc
Does it really matter?
No.
From a scientific point of view, the tiny differences would probably make sense: why is the 0.0X difference there and what are the phenomenons implicated, but for the end user is very much just the same. We will probably won’t get more than 0.10uSv/h in differences attributed to user misuse, misplace or other errors. We are still in the safe zone.
But things change when the monitor placed outside your house shows increasing readings, that quickly jump from 0.13uSv/h to more than 1uSv/h like it happened in Japan.
It sure means a lot when you live in a country close to another where a plant has gone critical, and you worry about the wind direction, and then you see you got lucky, but your friends somewhere far away didn’t get that lucky as monitors close to their location register increasing readings.
IMO, It’s not the small differences caused by mounting the device differently that matter. But the significant changes, that when plotted on a map, can provide some great indications on the cause of the incident: The variations will be there, regardless of how well the monitors are installed.
Hi, I’ve used the SBM21 before and these work well.
Despite being relatively insensitive they can be “boosted” to 480V and still work,
roughly 3* as sensitive as the ZP1314.
Also relevant, my idea of using pyrographite end windows to pass alphas, I discovered this back in 2009 but not much has been done with it since.
Works best with very thin layers and the CMOS B/W camera sensor underclocked to about 4 Mhz from 13.5 MHz or 14.3 depending on where you get the cameras.
Kind regards, -A
Hi Andre! Nice to see a fellow 4hv-er here 🙂
Increasing the voltage arbitrary, can get the tube out of the Geiger Region (also called the Geiger plateau).
The readings would then be irrelevant, as you know there is a certain voltage interval where the tube’s output is stable due to correctly functioning quenching mechanisms. Beyond the datasheet voltage one might experience avalanche discharges, and shorten the tube life significantly.
There is no advantage in getting a higher CPM rate from a tube, if correct time integration is applied upon the readings, so really not much reason to “boost” the voltage – actually I would take the voltage to the very inferior limited allowed as per the tube’s specifications, for prolonged lifespan.
An excellent read that I would like to suggest: http://www.centronic.co.uk/downloads/Geiger_Tube_theory.pdf
CMOS sensors are indeed excellent for detecting radiation, while not as sensitive as a Geiger counter, they prove reliable detectors. I’ve done a few experiments in this direction myself, I might post the results some day.
There are also the scintillation detectors (see http://www.pocketmagic.net/2010/11/scintillation-probe-with-photomultiplier-and-nai-crystal/) but that would prove prohibitive to the purpose of the uRADMonitor project, due to high costs (the scintillation material and the photomultiplier tube).
>
Radu wrote:
– a poorly ventilated cellar shows 0.17uSv/h
– a concrete made storage room shows 0.15uSv/h
– the room I’m living in shows 0.13uSv/h
– a salt mine shows 0.06uSv/h
– the inside of a house made of bricks 0.12uSv/h
– etc
Does it really matter?
No.
>
Respectfully – I disagree, it matters a lot. you have a few hundred percent variation there on a very low background number. imagine if there is a rad release from a powerstation and you get a low energy emmitter such as Iodine or cobalt 57. Your car will read anything up to 500% higher than your concrete storage room would due to its location, and it would read a few hundred percent higher for colbalt than it would on Ceasium. Move the detector a few feet up and it will read even more different. Trust me I do this for a living, unless your geometry, compensation and measurement criteral are standardised on the network in some way, the readings will be completley meaningless once they are above background levels.
The danger is people use this info in an emergency and it actullay could kill them. Honestly you need to properly compensate the detector to H*(10) otherwise the readings might as well be in bannanas per month!
There are strict legal requirements for doserate measurement instruments in most countries (Europe/usa). if you end up selling kits or working instruments commercially they must have a valid type test and suitable cal cert, or you could end up with the HPA/NRC etc on your back, so it might be worth using a commercially availible compensated GM-tube, as at least that is linear to energy.
Kind regards
Mark
Hello Mark,
Thanks for your comment. May I ask what exactly is your specialization and area of expertise (that you mentioned doing for a living) ?
Also, I would be curious to know some of the tools you are happy with, both from a “compensation ” and “measurement” point of view. Name a few, and we can discuss the differences.
I have the feeling Mark’s interpretation on the numbers quoted was wrong, so I will throw in a few details: the numbers were not measured with my device, but with a calibrated dosimeter, so I’m not sure of what exactly “a few hundred percent variation” is referring to. The differences in the mentioned situations are to be expected because:
– a poorly ventilated cellar will have a higher concentration of radon, infiltrated from the soil, especially those rich in natural uranium or thorium;
– a salt mine will have lowest readings as it works as a shield from most natural radiation sources (cosmic and terrestrial);
– concrete vs brick walls, again we are talking of minor differences because of levels of natural uranium/torium contained in these materials;
Setup geometry might be important, but not for the purpose of this project, which is building a surveillance network and not a scientific lab grade tool. And let’s not forget that what we can always interpolate the data as an average of multiple readings: If one of ten people mounted the device wrong, we will still get a clear picture thanks to the data coming from the other 9 users that mounted the device correctly.
The interest here, is focused on being able to record a change. Ok, your device might be mounted 5 meters above the ground, and your neighbor’s just 1 meter above the ground, so your readings will be slightly lower, but you’ll both get a dramatic consistent increase in levels if a powerstation blows somewhere close. And I’m saying consistent because this is not a sharp maximum on the chart, but a rising graph permanent in time, that can be checked against other detectors.
Getting the “trending data” will be more important than a singular indication of any single given device.
As the network is to be composed of IDENTICAL detectors the compensation and measurement work in the same way. Leaving geometry outside, I still feel we are in a safe interval of error, and nothing even close to “meaningless” as Mark said. We are not collaborating on global data with random detectors; We are not taking in measurements done by various devices either; We are not taking in manual data input. What I’m planning to do – is to have a single type of detector, build against precise guidelines that will be used to measure the radiation data.
I will not delay nor waste any more time of this project’s progress, just because it is not precise enough to be used as a scientific instrument. I’m sure it does a great job as it is, especially when compared to the dosimeters I’ve seen on the market.
Let’s not try to cover radiation dosimetry with a mystical layer of untouchable complexity. We are talking about just another engineering field, where knowledge can be put to practice just like anywhere else. We’ll get errors, sure, a maximum tolerance will be provided, but this is just the way the physical world works. As Herbert said above, “This has always been an issue, as “radiation” is not an easy thing to measure reliably, let alone interpret it in detail.”
Hi Radu,
To Clarify – I was refering to the external gamma doserates from outside the building. Specifically the radiation you would get from a nuclear leak, weapon or other incident (from the contaminated material raining down). This is mainly in the form of low energy isotopes (initially at least) such as Colbalt, Iodine etc, the low energy isotopes have short halfives, so later Ceasium is the dominant worry as it is in Fukishima. If you put your detector outside you will detect a LOT more of the low energy isotopes, if your detector is in a basement, you would detect a lot less of it. Now if your just talking about Radon (Totally the wrong GM-tube to detect RADON with any effiency btw), then it will accumulate in dead spaces like cellars rather than in the open air (but why would you make a monitoring network for Radon?, it is very much house specific due to the ventillation etc and it wont change by much on a daily basis).
>May I ask what exactly is your specialization and area of expertise (that you mentioned doing for a living) ?
Design Engineer for Southern Scientific in the UK, I design radaition Monitors.
>>Setup geometry might be important, but not for the purpose of this project, which is building a surveillance network and not a scientific lab grade tool
Whats your understanding of a survelillance network?? if its not to measure the radiation in the area of the detector, and for that you need to measure doserate, To read doserate, you need a compensated detector, it’s not about being ultra precise its about not getting a 10:1 ratio of Co-57 or AM-241 to Co-60, the spec for H*(10)
Hi Radu,
Your right in that if all detectors are the same it helps matters, but only if you know the isotopes giving you the reading!
To Clarify – I was refering to the external gamma doserates from outside the building. Specifically the radiation you would get from a nuclear leak, weapon or other incident (from the contaminated material raining down). This is mainly in the form of low energy isotopes (initially at least) such as Colbalt, Iodine etc, the low energy isotopes have short halfives, so later Ceasium is the dominant isotopic worry as it is in Fukishima. If you put your detector outside you will detect a LOT more of the low energy isotopes, if your detector is in a basement, you would detect a lot less of it. Now if your just talking about Radon (Totally the wrong GM-tube to detect RADON with any effiency btw), then it will accumulate in dead spaces like cellars rather than in the open air (but why would you make a monitoring network for Radon?, it is very much house specific due to the ventillation etc and it wont change by much on a daily basis).
>May I ask what exactly is your specialization and area of expertise (that you mentioned doing for a living) ?
Design Engineer for Southern Scientific in the UK, I design radaition Monitors.
>>Setup geometry might be important, but not for the purpose of this project, which is building a surveillance network and not a scientific lab grade tool
Whats your understanding of a survelillance network then? – if its not to measure the radiation in the area of the detector? and for that you need to measure doserate, To read doserate, you need a compensated detector, it’s not about being ultra precise its about NOT getting a 10:1 ratio between Co-57, AM-241 and Co-60 or Cs-137, (the spec for compensation for H*(10) is +/-20% across the range 60Kev-1.3MeV.)
>>Ok, your device might be mounted 5 meters above the ground, and your neighbor’s just 1 meter above the ground, so your readings will be slightly lower
Slightly? No, massively try it put a source 1M from your tube thenm put it 5M away heres an example:
1GBq of Americium-241 at 1 Meter would measure 4uSv/Hr
1GBq OF Americium-241 at 5 Meters would measure 0.15uSv/Hr
1GBq of Ceasium-137 at 1 Meter would measure 76uSv/Hr
1GBq of Ceasium-137 at 5 Meters would measure 3uSv/hr
So you can see there is a large difference, if you had some detectors inside, some on a roof and some on the ground then aggregating all of them means nothing.
Only if you know where they are positioned can you use the data for anything.
To compensate typically only requires some copper and tin wrapped around the detector, but this would have to be derived by experiment, maybe the GM-Tube manufaturer could help on that one?
The other option is to just display counts per second, this way it is obvious the readings are not calibrated and the world knows that the data needs to be correlated to the specific tube type.
Just trying to be helpful here, your of course free to go down which ever path you want, there are so many online radiation monitoring networks comming online nealry all of which have data which I wouldn’t rely on in a nuclear event.
Best Regards
Mark
Appologies for the double posting – finger trouble!
Mark
No worries Mark, your pertinent feedback is appreciated so feel free to send in as many messages as you like.
And I’m glad to know that you work in this field!
The project is progressing and with your permission I will try to focus on how to make it better, and less on the no-can-does.
I am well aware of the technical details you presented.
Since we agreed that 1) we will have a network of identical units, calibrated to the same standard; 2) the units will be compensated for
energy response ; ,
3) Another concern remains related to the setup geometry. Now for radiant energy such as the one produced in radioactive decay, it is known that the intensity decreases to an inverse-square law with the distance. Things are getting more complicated when we are talking about multiple tiny sources, spread by rain and wind like in the case of an environment contamination. We both discussed and you also provided the numbers, that if we place the detector at various heights we will get varying readings changing with a few orders of magnitude (!) – if we assume that has been some highly active fallout now covering the soil.
The problem here is that this project can happen only as a successful crowd funded project, where people that payed, get a detector to keep.
And they want one so they can monitor their own environment, and the places they live in. It’s their right to choose to place it in the basement, or outside their house. The monitor has to keep an eye on “their” own levels.
But as stated before, regardless of how these factors are affecting the results, and regardless of where the detector is placed, we should get almost constant readings (constant for a given location), unless a significant radiological event takes place. The data I gathered for almost a year using my first variant of this device (http://uradmonitor.pocketmagic.net ) shows only minor variations. A completely different story when something bad happens: the charts would rise drastically. This will happen regardless of calibration, geometry or even setup geometry.
It would trigger an alarm and people would be free to find our what is going on. A lot better than knowing nothing at all! And here is where the surveillance comes into effect : we can track “a trend” and understand what is happening especially if we correlate the data with meteorological data like wind direction and speed.
This “trending” concept is so useful, that can way beyond the errors.
It’s funny Mark, just look what we are wasting time with, not to mention getting into the correct formulas for computing the absorbed those, and then the equivalent dose related to various organs or types of radiation, statistically matched to a model of human body geometry ; the users of this device WILL NOT be interested in that. Will NOT know how much damage a Sievert of radiation does to them . Do you Mark? Will an acute exposure to 100mSv damage you in any way? Will it damage me? Will it shorten our lives? You see, this is getting to a point it shows no interest to the user. The truth is we don’t know. Nobody knows. We can only use statistical models. At least the trending concept provides some real-time useful information: something is changing. Or : something is going to a level where 10% of exposed people are manifesting nausea. Or to a level facing a 30% chance to develop cancer in the next x years. And so on. I hope we won’t get to see such huge variations.
Of course there are other issues too, such as:
4) Not knowing the energy level / the type of source producing an event, with some impact on the dose calculation.
But honestly this is the current technological level, at least if we want to remain in a reasonable budget.
Other professional dosimeters are doing it in the same way.
And this brings me back to my previous reply, let me know if there is a dosimeter based on a geiger tube that you are happy with, and we
can discuss the pros and the cons based on that particular example.
I’ve seen (expensive) commercial dosimeters both compensated and uncompensated – funny for me to see a recent trend, especially for more
notorious devices, to market their “compensated” attribute, like it was something special. Sorry it is not – it is just a simple way of
making a linear response to a very non-linear characteristic: http://www.pocketmagic.net/wp-content/uploads/2012/10/6993_energy_curve_800.jpg
(We block partially or totally that energy spectrum that causes increased un-proportional readings – by using a material with a thickness chosen so that it would block / attenuate the radiation we are interested in).
So if we get into all this we would probably never finish. But I want this to happen and will focus in this direction.
Pingback: UT50 NaI Scintillation probe « PocketMagic
hi RADU
good idea for measurement of ENVIRONMENTAL RADIOACTIVITY
http://en.wikipedia.org/wiki/Environmental_radioactivity
Hi Radu,
I have to agree with Mark, you cannot provide readings in doserate or dose unless you know the isotope and detector response for the energies emmited or have an energy indepenent or compensated detector. An SBM-20 won’t do this, neither will a BPW-31 photodiode. If you get a reading of XX on two units in different locations how do you know if it is a small amount of low energy contamination or a large amount of high energy? I know there are lots of commercial “instruments” out there that use these detectors, but this does not mean they are any good! The “calibrated” ones typically have had ONE example checked with ONE isotope, typically Cs137. The sellers then transfer this single data point to their production run. Trouble is the buyers don’t know any more than than the sellers so they don’t complain. The profesionals (and good amateurs) don’t buy these units.
If you stick with cheap old stock soviet tubes you are just the same as all the others and deceiving yourself and your customers. Certainly here in the UK you would be fallling foul of the various trading laws. Have you also considered the cost (and designed for) the testing required before you can sell these?
As a minimum in the EU you would have to CE mark it (EMC directive and Measuring Instruments Directive)in the USA it would be FCC and possibly FDA. I’ve asked a couple of sellers for their approval certicates and they have not provided them.
Hi Robert. I am aware of limitations you kindly indicated, but I am also determined to push this project forward despite all the “no-can-does” comments. For all these arguments against the project, one can come up with other arguments supporting it or proving its necessity. It’s not precise? Maybe, but it’s affordable. And so on.
Regarding the technical details involving various isotopes, different answers to different energies, energy response compensation and other limitations of the Geiger detectors, I believe I have already answered in my previous posts.
Calibration and exact readings become of secondary importance when the “trending data” shows something is happening. It’s enough to show a sign that something is happening, and the user can seek out for more information.
Besides that, known manufacturers still use Geiger tubes, in dosimeters such as the SEINTL Inspector, Gamma Scout, Terra-P , and your statement with “deceiving” is a bit off here. Not to mention that you would be surprised to see how many professionals still use such units.
My belief is we are better in having a tool like this, than to repeat well known episodes of panic and media misinformation, as it happened with every major nuclear accident in history. There’s a lot to talk here, but unless it’s about solving some of the issues and making the tool better, I feel I am loosing precious time.
Hi Radu,
If it is for comparison only, then do not even try to convert to doserate. Just report counts per minute. This is easy and accurate. If the user knows the isotope present and the energy response of the tube they can make their own estimate of doserate.
Salut, Radu. Doresc sa fac si eu un aparat ca al tau, cel cu display de Nokia. Doresc sa-l folosesc ca un detector portabil… ma poti ajuta cu hex-ul si schema pt el ? Thnx si sarba[u]tori fericite alaturi de cei dragi.
Alex.
Salut Alex,
Cred ca da, dar mai dureaza putin pana voi avea designul final pentru modelul B, care va avea si ecran.
Placa cu display Nokia la care te referi a fost doar un prototip, si desi functioneaza foarte bine, prefer sa public schemele finale , acolo unde se poate.
Ok. Astept cu interes publicarea schemei finale.
Alex.
Hi Radu!
This system seems beautiful, but so far it lacks from some features:
First of all, many people are scared concerning the radiations, but almost all of them lacks of tecnical skills: three LEDs (or maybe a multicolor LED) can do the minimum warning job (normal-abnormal-danger!) for a small price; you can also add an audible alarm.
Both warning devices (visual and acoustic) must work even if the equipment is disconnected from the network (so a customer can use the device as standalone radiation alarm without having a cabled network).
Than, one cable is better than two, specially if the equipment is permanently installed (as a network-based radiometer should be): a POE feature can be really useful (but don’t remove the power jack to allow the use as standalone alarm).
finally, a network-based radiation monitor is not intended to be portable: a nice wall mount case, preferably waterproof, could be a really nice option!
I think that a wheaterproof monitor intended for permanent installation is NOT particulary difficult to sell because the market lacks of small and cheap instruments intended for permanent installation, making your instruments the only choice! (many of all potential customers usually look for a portable unit but the market is almost full of these!!!!)
Ciao!
Fabio.
Thanks Fabio, for the excellent suggestions!
La multi ani, Radu.
La multi ani, Alex!
Hey Radu
The monitor is running fine and no problems so far (station 11000003).
A few suggestions to the uradmonitor.com map
– Link to installation page / picture / description of installation to give viewers the ability to do source critism.
– Uptime and downtime counters, for how long have the monitor been online without interruption and for how long have it been offline without consistent data.
– Automatic removal of offline monitors after say… 1-2 weeks from the map, will automatically reappear when connected again.
Kind regards
Mads
Hi,
Looking at the video with the Ra226 source in a vacuum tube:
(1) 7 microSieverts and the display says DANGER! That is harmless, unless you eat it.
(2) The display hovered at various values from 5 to 8 microSieverts per hour, which is expected from the random nature of radioactive decay, however, at times it flipped to only 1.4 microSieverts per hour. That much variation is a far greater excursion than the randomness of radioactive decay, you can clearly hear that the pulse rate remains quite fast, and does not suddenly drop by a factor of approximately 6. So your display algorithm is somehow losing counts at times. I set up a similar gamma field into a totally analogue radiation meter, switched to the fastest response time. With a normal reading wandering from 5 to 8 microSieverts, there was some typical count variation, it didn’t drop to only 1.4 microSievert per hour. I was not confused by the autoranging to milliSieverts.
3. While watching the demonstration, the measured voltage applied to the tube varied from 393 to 407 volts. Do you have no proper regulation of the high voltage? That is one contributing factor to variation in reading. Tubes vary quite a bit, and I have no experience with the tube you used, but most of them change their count rate if the HV varies.
4. Have you make any accounting of the effects of pulse pile up and tube dead time? Do you know what the dead time of the tube is, and I’m not talking about the specifications, but actually measuring dead time under your usage conditions.
5. While measuring world levels is an ambitious goal, have to checked how much the calibration of these GM tubes varies from one to another? If not, you have some pretty graphs but no data. Setting up a calibration rig for GM tubes is probably beyond the means of most amateurs, but having a hotter source, and a suitable physical dimension control jig would allow you to at least make comparative checks between the tubes you send out, and then you could apply a calibration constant to each tube which would make relative comparisons between your different measurement points useful. Credit goes to you for a nice web site, good description and nice electronics work. You have done a nice job, but please be cautious about drawing any conclusions based on the measurements that are gathered. If local temperature variations work like usual, the results of each site are not comparable. Only variations from each site as an isolated data point is possible. Science is a laudable goal, but amateur science runs the risk of being irrelevant if the importance of calibration systems are not appreciated.
Best wishes, Will
@Will, I’ll do my best to answer your long message, given my limited time. Unfortunately most of your comment is based on a video of an early prototype board, that has almost nothing to do with the current design of the uRADMonitor units. If you carefully read this entire article, you will learn more on what has changed on the long road of making this network happen.
“Will: (1) 7 microSieverts and the display says DANGER! That is harmless, unless you eat it.”
When discussing any thresholds for safety to humans, a key factor is the time of exposure parameter, so a “bigger” dose can be relatively safe if the exposure time is short, but also a constant “medium” (means smaller than the “bigger” one) dose can become a problem if exposure is prolonged. (try sleeping with the Ra226 source under your pillow for a few weeks to know what I mean).
But here you are missing the entire point of this project, which is environmental surveillance, so when you are saying that 7microsieverts (/hour??) is harmless is Wrong! The normal background radiation is somewhere close to 0.10microSieverts/hour . If your measuring device shows a dose rate 70 times bigger, it is clear something wrong has happened (nuclear contamination, nuclear accidnet, etc).
“Will: (2) The display hovered at various values from 5 to 8 microSieverts per hour, ..”
That was just an early test, and the software in that board presented an integration configured for 5 seconds. So instead of waiting 30seconds to see the result like on most units on the market, the devices was doing a “best-effort” approach to estimate the dose as fast as possible. This works for higher doses, but there are obvious problems for weaker sources. Again, this has nothing to do with the uRADMonitor network: the nodes in the network measure the counts for every minute, and send that data to the server. As you guessed this was related only to the algorithm on that particular test board.
“Will: 3. While watching the demonstration, the measured voltage applied to the tube varied from 393 to 407 volts..”
The high voltage supply is constantly controlled by the microcontroller. The mechanism is as follows: the microcontroller generates a PWM signal, that drives the inverter, with a default duty cycle and frequency set to match the 400V output (or 380V like it is used now). Then when the device is turned on, a feedback mechanism constantly measures the voltage output (via a voltage divider and and Analogue to Digital port on the uC). If the voltage is out of a given tolerance interval (Currently set to +- 5V), the microcontroller automatically adjusts the duty cycle to compensate. So if you are truly concerned about this issue, why not look at the current implementation and see the nice constant voltage level. I put all data open to public, see it here:
http://www.pocketmagic.net/2012/10/uradmonitor-online-remote-radiation-monitoring-station/#charts
(the voltage charts – there you have the data for two units, 0000001 and 12000007).
It is obvious that the voltage stays well between the tolerance interval.
“Will: 4. Have you make any accounting of the effects of pulse pile up and tube dead time..”
To put it into simple terms, each uRADMonitor station does the following: it measures time and it measures counts, and does this very precisely. It is as simple as that. This data, numerically equal to the CPM (counts per minute), is then sent with a 1 minute resolution to the server.
For smaller doses (like the Normal background radiation), the percentage of occurring tube dead time events is statistically smaller. To compensate there are several approaches, but the simplest is to “know” the rate of occurring dead tube intervals and add a small percentage to the final result.
As you probably know, the dead time becomes an issue with the increasing dose rate. The data on the server can be further changed to match various mathematical adjustments, including the dead time on a statistical model, as for each data set we also know the tube used to measure the data and its characteristics (currently 3 tubes as used, SBM-19, SBM-20 and SI-29BG). So this is very much covered as well.
“Will: 5. While measuring world levels is an ambitious goal, have to checked …”
Let’s not cover this topic with a veil of untouchable complexity, because after all, a Geiger counter only counts the pulses and measures the time, so no need to worry that much.
But I am always open to good suggestions to help the project move further.
What you said about the “Local temperature variations” is again wrong, there are a few good books on this topic that can clarify this aspects, let me know if you have the time for a good lecture, can send you a list.
A Geiger tube is designed to function at a given tolerance in the given temperature inteval:
Just as an example, Station 0000001 is up and running continuously for a year and a half and has seen temperatures ranging from -20°C to 40°C (in the summer) and guess what: perfect stability.
I have also run additional tests where Geiger tubes were heated close to 60°C while the pulse rate remained consistent to the radiation field they were exposed to.
“Will: but having a hotter source, and a suitable physical dimension control jig would allow you to at least make comparative checks between the tubes you send out, and then you could apply a calibration constant to each tube which would make relative comparisons between your different measurement points useful.”
I do comparative tests not only between the tubes, but also between the final results measured by each station. As you know there are several sources of error: the tube, the thickness of the enclosure, the capacitance of various areas of the PCB traces, the tolerance of the components (just think about the feedback mechanism keeping the voltage constant – the divider uses a 10MO resistor – tolerance here is crucial – so it is measured manually and adjusted in the software), internal clock, contamination of materials used (tubes, electronics, case, etc) . I can put a big list here, but the final devices are always checked against a stronger source (on varying distance) and calibrated / certified dosimeters.
Hello Radu, thanks for the reply. If you have addressed some of the issues with newer design, like HV regulator, then that is good. But 7 microSieverts per hour is not dangerous. If I chose to sleep each night for a year with this exposure for 8 hours every night, the total end of year exposure would be 20.4mSv. That is my normal working exposure for a year as a radiation worker. 20mSv is considered a safe level of exposure over a year by most governments. In a practical world, if I have one chest CT in that year: I have 3.6mSv background, 8mSv for chest CT, and 20.4mSv for sleeping every night with your “Dangerous” 7 microSieverts per hour. It makes total of 32 milliSeiverts in one year. That exposure is totally legal and considered safe by risk averse governments all over the world. The total exposure from a typical heart stress test done using technetium99m is somewhere around 30 milliSieverts for a single procedure. Yet doctors order this regularly. If anyone suffered harm from that exposure, the doctors would be litigated into oblivion, given the grasping world of patient litigation. So, 7 microSeiverts per hour is harmless. Radu, it is less than a typical fully legal, freely owned, non-registered check source. All western governments agree that no matter how stupid you are with a check source, you will come to no harm. There are very large safety factors built into current legal controls over radiation. If you can legally own that source without having to register it or pay a large annual fee, then it is harmless. Best wishes, Will
Hi Will,
I understand your point. Do you have any “absolute” recommendations on given thresholds for the various warning levels?
My idea, and this is what I have presented above, is that if the measured dose changes significantly, it is an obvious sign something wrong is happening. Sure that doesn’t necessarily have to kill you, but prompt reaction is needed. Terra-P for instance, sounds the alarm when 0.30uSV/h is reached.
Keep the feedback coming. I appreciate discussing any improvements and new ideas. What do you think about the new case with wall mounting? I like the aluminum casing, but am unhappy with it blocking the betas. Drilling holes will loose the waterproof attribute.
Citez de pe un forum: “Am finalizat mai multe unitati, toate verificate si calibrate de curand. Cine e interesat poate sa ma contacteze pe PM, cat mai am unitati disponibile.”
Vreau sa pun si eu una la Braila. Cat ma costa si alte detalii tehnice legate de internet, configurare, locul de monitorizare (pot sa o pun in casa ori trebuie afara, etc).
Hello, is this project still running and how can I be a part of it? I don’t much in any links on the main page. I came across the site during a search and looked interesting and I am part of 2 uploading sites now. Would like to know more about it and how to get a sensor/unit… thank you
Salut, Radu! Ce trebuie sa fac ca sa imi construiesc si eu un dispozitiv si sa-l introduc in reteaua ta globala de monitorizare? Dispun de mai multe tipuri de tuburi geiger, ma gandeam sa pun cateva SBM-19 in pararel pentru a mari sensibilitatea. Sunt din Bucuresti si as vrea sa introducem si Bucurestiul pe lista de monitorizare. Ma poti ajuta in acest sens? Multam.
Salut si din Republica Moldova. Am aceeasi intrebare ca si ultimele persoane care au comentat aici si observ ca nu au primit raspuns (presupun ca odata ce este email-ul..). Vreau si eu, de asemenea, ca Chisinaul sa fie si el pe lista de monitorizare a acestui frumos proiect. Poti sa ma ajuti cu informatie privitor introducerea dispozitivului in sistem? (desigur daca asta mai este o optiune). Multumesc mult!
Sure don’t have a lot of stations still on this site since the last time I checked in. Great site and mapping, and do realize it takes a calibrated unit to join, but just too much to put out and not many on at the current time. My other sites are loaded with members and units. But I do see that this site would be nice because all would have the same type of counter running and levels would all be in line.
@Alex, Mihai, imi cer scuze ca raspund greu, am fost ocupat. Ce fel de aparate aveti voi? Eu am gandit acest sistem bazat pe unitati produse de mine, ca sa avem garantia unei calibrari meticuloase si a unor rezultate uniforme. Dar s-ar putea sa existe o cale si pentru a capta datele de la alte aparate.
@Frank: for a community oriented service, I got very little community support, but I’ve also been very busy lately. Indeed the plan is to make sure we are hitting a standard with what joins the network, but also have the process automated. As you see, my units come with a network interface, reporting the data automatically via the internet (no human operator is needed). What other sites are you talking about, feel free to post any links.
Hi Radu, agree with what you said and I always come back to check on things and progress. The other sites, and really not to take away from this one as I think its a great site and place and would like to see it really grow like the others out here, but the ones I am currently on now are Radmon, NETC and Radiation Network. I’m using one counter to feed two sites at the same time. 3rd one in an indoor unit. Radmon and NETC are my priority sites and I am on them maps. Maybe in time, perhaps when cost either comes down or something happens I can join this one as well. I’d like to be uploading my data to as many sites as possible for all. Thank you
I understand both sides of the argument here
it’s true that displaying Sv is misleading, because even your reference gamma counter is only certified to display Sv dosage for one particular isotope – most likely Cs137. The moment you introduce another isotope (and that is very likely to happen in case of environmental monitoring), this is meaningless. BUT(!) if all the devices use the same reference, and CPM is also available, you can still have meaningul data out of it in terms of trends – if CPM and the corresponding dose rate increase, then it’s likely “something” has happened. If your background radiation rises from 0.1μSv/h to 1μSv/h, what does that tell you? Do you really care if you’re getting exactly 1μSv/h dose from Cs137? I guess not. You’re alarmed that “something” has happened and you’re free to investigate/ask what, and that’s important. It might be that you in reality are getting 5x the dose because of large increase of some other isotope, but at that point there’s very little equipment that an amateur can use to discriminate them.
I for one have high expectations of this project, even if some assumptions made are incorrect.
If you want to cut this argument short, you can simply remove the Sv dose rate from the calculation and display only CPM – that way it will not be biased by any such assumptions (but for an average Joe, this will be harder to interpret – is 20CPM bad? Or is 2000? Unless you implement alarm for some threshold – but once again, what would that be if you pretend not to care about dose?).
As for indoor/outdoor argument – it might be valid if you’re concerned about precise measurement of something – but even in your basement, if something happens you will get increased reading – maybe it will jump 50% less than if it was mounted outside, or it may be delayed, but if the increase is significant it doesn’t really matter becase you don’t know what isotope you’re measuring anyway.
When you look at how people (even some physicists) measure radiation, you will see them refer to a dose in Sv when going radiation hunting – “look it’s showing 1mSv, that huge!” – WRONG (most of the time), but as a reference if it normally shows 1μSv background, it still is indicative that it indeed is very active. So why should we not simplify in the same way? Leave the exact calculations to the professionals, and let’s give people something easy to use, easy to cross-reference, and if something important happens there are other instruments out there that professionals or enthusiasts can use to tell us exactly what we found.
If you wanted to make a really exact network, every device would need to be equipped with energy compensated a/b/g tube and possibly a scintillation block, mounted in the same position, same environment, undisturbed by local contamination (radiology patients walking around, potassium salt transporting trucks, people trying if their watch “click” on the device”…) – if we were government, we might build something as expensive as that, but you can’t do that with <$100 budget, and for that budget this is as good as it gets – no complaints.
Hi Radu
I think this is a worthwhile project as long as we are all recognising the limitations in the performance of the hardware and in how the data may be interpretted. The concept of having a global network of identical (or very similar) detectors making continuous relative measurements is a useful one. As you know I have expressed an interest in buying one of these units and my interest will be in comparing trends over time in different geographical locations with respect to naturally occuring phenomena that affect the flux of ionising radiation over a large area e.g. CMEs etc.
My own preference would be to use CPM as the default measurement with an option (maybe on the graph) to convert this to ‘approximated absorbed dose’ units if users really want to see this information, providing they are understanding the important issues around detector energy compensation (or lack thereof) etc. Maybe an enhancement to the presentation of the data which steers clear of the complexities of dosimetric measurement would be to present a raw CPM value alongside a % change from mean baseline which in turn could be calculated from a long time series of measurements at that particular location(e.g.first month after initial power up).
Good luck with the project
Richard
Have there been any changes to the png generator code? I can no longer get a 12 day long graph with this “http://www.pocketmagic.net/uradmonitor/public.php?id=11000003¶m=cpm&size=xlarge&gmt=Europe%2FCopenhagen&interval=12&integration=4”, instead its just 1 day with 4 hour integration.
Hi Mads, yes . Please used “start” instead of “interval” . There is also a stop in case you need it.
Thanks Radu
Do you have a updated list of parameters available online?
Is it possible to draw detailed 1 hour interval graphs just with parameters now?
Kind regards
Mads
Pingback: A year to remember - uRADMonitor
Pingback: Small size High-Voltage regulated inverter - PocketMagic
Pingback: ESP8266 Troubleshooting - PocketMagic
Pingback: Model KIT1 - Production Ready! - uRADMonitor